
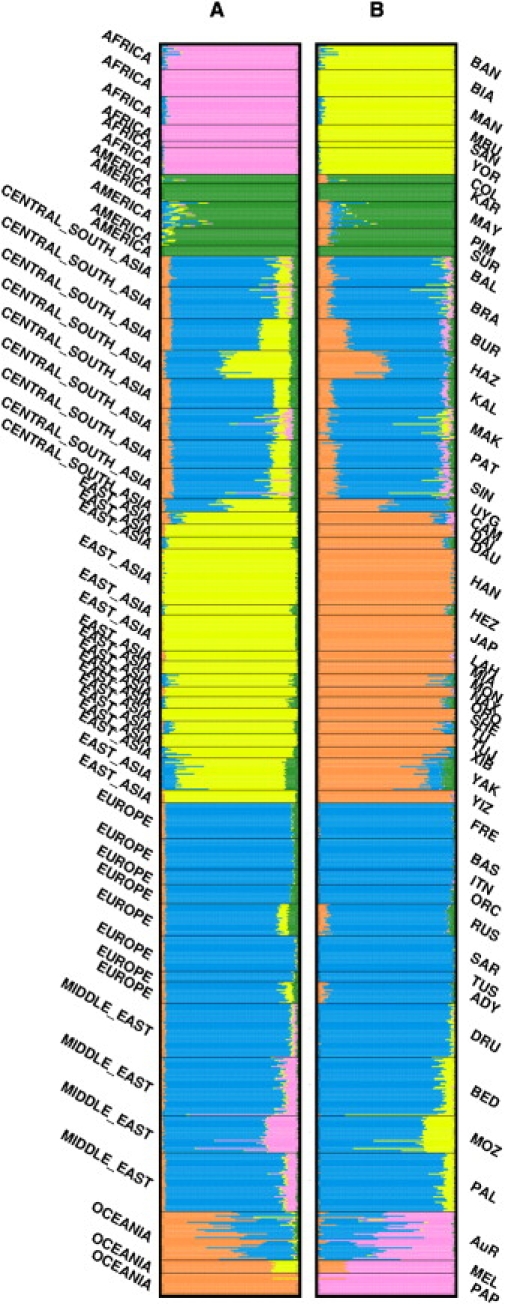
Figure 3.
Population Structure Analysis
Individual ancestry proportions in the HGDP and Aboriginal Australian (AuR) samples at K = 5, from (A) frappe analysis, with all 155,166 autosomal markers, and (B) STRUCTURE analysis, with a one-tenth subset (15,516) of all autosomal SNPs. Each horizontal line represents an individual and is divided into K (number of population clusters) colored segments reflecting the estimated ancestry proportion from each cluster. Different geographic samples are divided by black lines with population and region indicated to the right and left of the plot, respectively. See Table S2 for a full explanation of population codes. frappe analysis used 5,000 expectation-maximization (EM) iterations whereas STRUCTURE runs were conducted under the admixture model with a 25,000 replicate burn-in followed by 25,000 Markov chain Monte Carlo (MCMC) iterations.