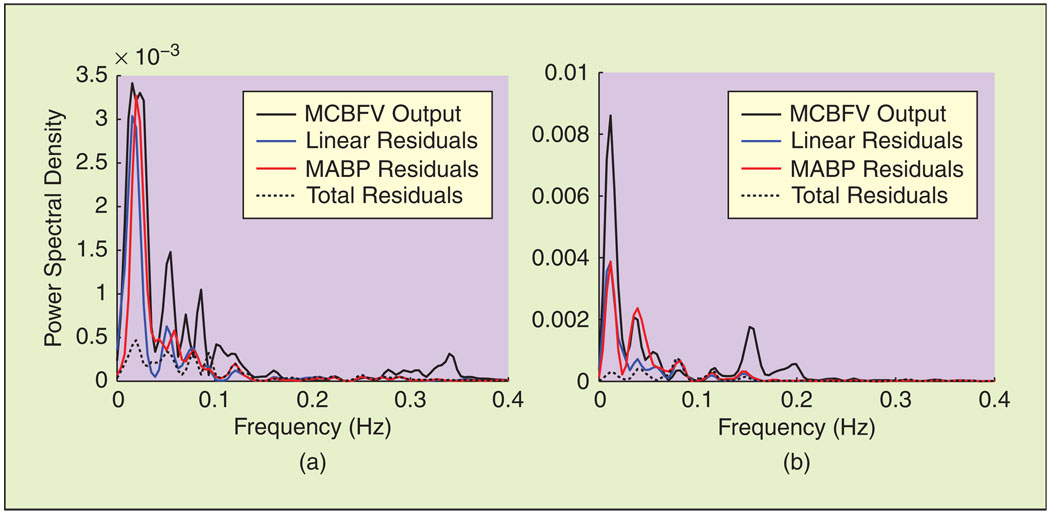
Fig. 4.
Spectral characteristics of model residuals for the time series of Figure 3. Most of the power of the linear model and MABP residuals resides in the VLF range, suggesting that the effects of nonlinearities and PETCO2 are more pronounced in this frequency range, both during (a) baseline and (b) ganglion blockade.

