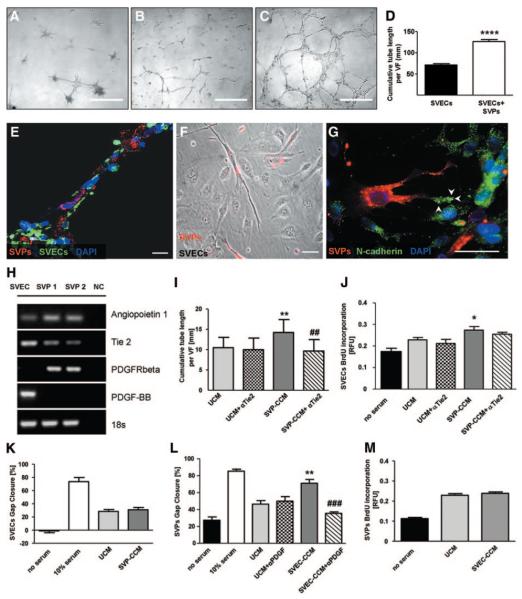
Figure 5.
Interactions between SVPs and SVECs. SVPs formed peculiar structures in Matrigel (A). Network formation was strongly enhanced in SVP-SVEC coculture (C) compared with culture of SVECs alone (B). D, Bar graph showing average tube length; values are mean±SEM of 4 experiments performed in quadruplicate. VF indicates view field. ****P<0.0001 vs SVECs. Confocal microscopy image shows tubes formed by SVECs (isolectin, green) and covered by SVPs (DiI, red; E). F, Phase-contrast microscopy image showing the interaction of SVPs (DiI, red) with multiple SVECs (unstained) in 2D coculture. G, Representative confocal microscopy image showing different patterns of N-cadherin staining (green fluorescence) in SVPs (localized at filopodia, white arrowheads) and ECs (diffuse to all of the cell membrane). Scale bars: 500 μm (A, B, and C); 50 μm (F and G); 20 μm (E). H, Expression of Ang-1/Tie-2 and PDGF-BB/PDGFRβ in SVECs and SVPs. NC indicates negative control. I through M, Bar graphs show the reciprocal paracrine effect of SVECs and SVP-CCM. SVP-CCM influenced SVEC network-formation capacity (I) and proliferation (J) but not migration (K). Tie-2 blockade inhibited the stimulatory action on the network-formation capacity of SVECs (I). SVP-CCM enhanced SVEC migration (L), this effect being inhibited by PDGF-BB blockade, but did not alter their proliferation (M). Positive control was medium that contained 10% serum, whereas negative control was serum-deprived medium. Values are mean±SEM of 3 experiments performed in quadruplicate. *P<0.05 and **P<0.01 vs unconditioned culture medium; ##P<0.01 and ###P<0.001 vs CCM. UCM indicates unconditioned medium; BrdU, bromodeoxyuridine; and RFU, relative fluorescence unit.

