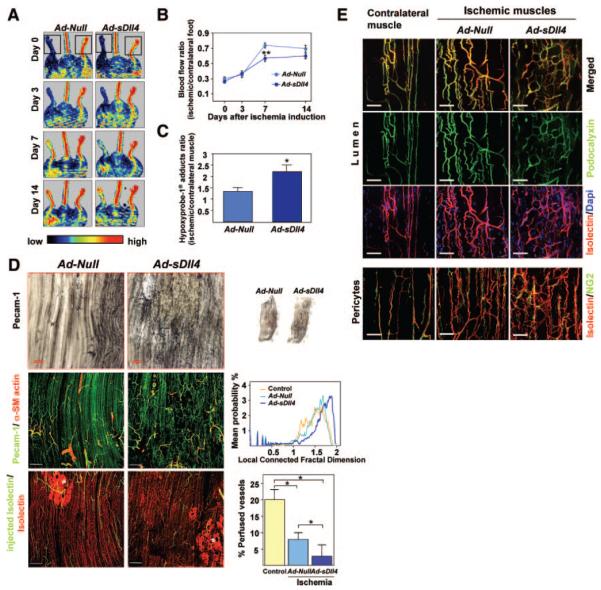
Figure 3. Dll4 inhibition impairs reperfusion and neovascularization of ischemic muscles.
A, Representative color-coded images of laser Doppler flowmetry. The dotted square indicates the feet, where blood flow was measured. B, Line graph showing the time course of blood flow. *P=0.002 vs Ad-Null; n=11 mice per group. C, Levels of hypoxyprobe-1 adducts (ischemic to contralateral muscle ratio) as an index of residual muscular hypoxia. *P=0.03 vs Ad-Null; n=5 per group. D, Top right images, Micrographs, taken at 14 days postischemia, showing whole ischemic adductor muscles stained with PECAM-1 (black). Top left images, Higher magnifications showing high density of vascular network in Ad-sDll4–injected muscles compared to Ad-Null. Middle left images, Representative confocal microscopy photographs taken at 14 days postischemia. ECs are stained with PECAM-1 (green), and vascular smooth muscle cells are stained with α-smooth muscle actin (red). Middle right images, Line graph illustrates local-connected fractal dimension analysis. Bottom left images, Representative confocal images showing perfused microvessels stained in vivo by biotinylated lectin (green). Samples were counterstained with lectin-Alexa 568 to label all vascular structure (red: total vessels). Asterisks show necrotic areas catch up unspecifically Isolectin. Scale bar: 200 μm. Bottom right graphs, Bar graphs showing average perfused vessel ratio. *P>0.05; n=10 mice per group. E, Representative confocal microscopy photographs taken at 14 days postischemia show similar lumen formation (podocalyxin, green) and vascular pericyte coverage (NG2, green) in ischemic limb muscles of the 2 groups. Contralateral normoperfused muscle is shown as reference. Scale bar: 50 μm.

