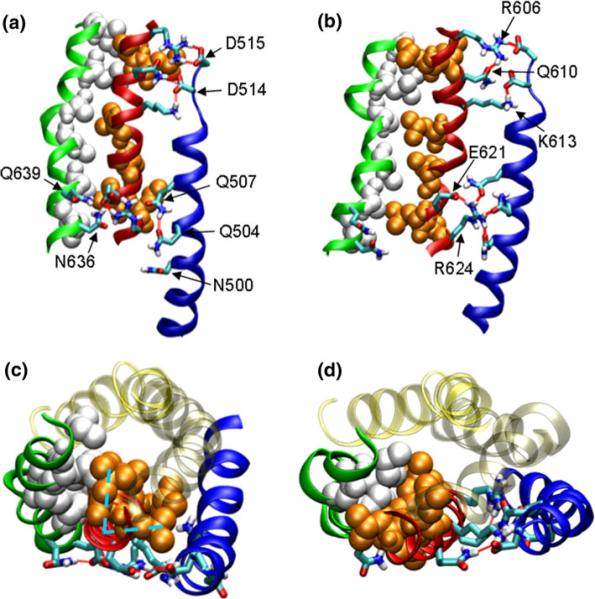
FIGURE 2.
Molecular dynamic simulation of the force-induced activation of talin's vinculin binding site (VBS1) (red ribbon with organ spheres). Helix H1 (blue ribbon), H2 (transparent yellow), H3 (transparent tan), VBS1 (red ribbon), H5 (green ribbon), hydrophobic residues of VBS1 (orange VDW; also the vinculin-binding residues), hydrophobic residues of H5 (white VDW), and some important polar residues (stick representation with color denoting the atom type). Polar residues are labeled on the figures. (a, b) side view; (b, d) top view. (a and c) Before the conformational transition, the hydrophobic residues of VBS1 are hidden in the hydrophobic core. (b and d) At increased force, the hydrophobic residues rotate and become exposed to solvent. Hydrogen bonds between H5 and VBS1 are broken. The hydrophobic residues, or the vinculin binding residues, point into the page in (a) and point to left in (b). (c) Conformation at t = 0.86 ns viewed from top. The V-shaped VBS1 hydrophobic residues are packed within the hydrophobic core of TAL5 (cyan dotted lines). (d) Conformation at t = 9.24 ns showing VBS1 rotation. The hydrophobic residues H5 (white VDW) fit into the `V' of the VBS1 hydrophobic residues (orange VDW). Reproduced with permission from Lee et al.52

