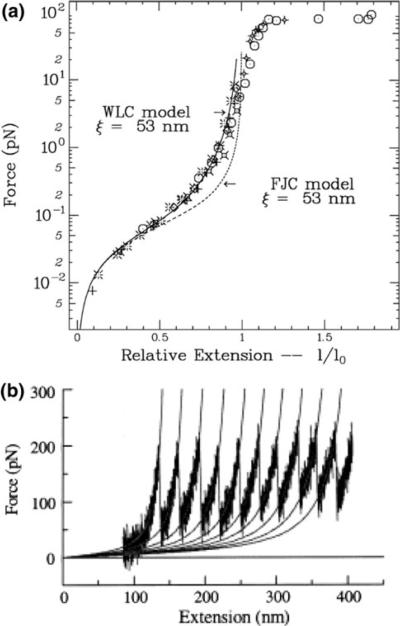
FIGURE 5.
The force–extension relationship for two biological molecules (DNA in (a) and protein in (b)) can be well described by a worm-like chain (WLC) model. (a) Force vs. relative extension curves of single DNA molecules. The dots correspond to several experimental measurements performed over a wide range of forces. The full line curve is a best fit to the WLC model for forces smaller than 5 pN. The dashed curve is the result of the freely jointed chain (FJC) model with the same persistence length. Above 70 pN, the length abruptly increases, corresponding to the appearance of S-DNA (reproduced with permission from Strick et al.77). (b) A force vs. extension curve of Filamin A protein in aqueous solution measured by AFM at room temperature. The WLC model fits the sawtooth pattern of the force vs. extension curve well where the force gradually increased after the abrupt decrease in force (reproduced with permission from Furuike et al.27).

