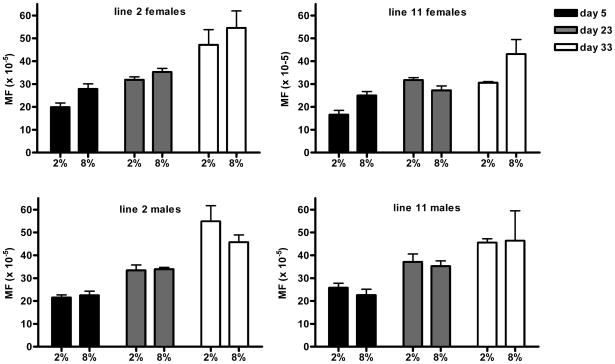
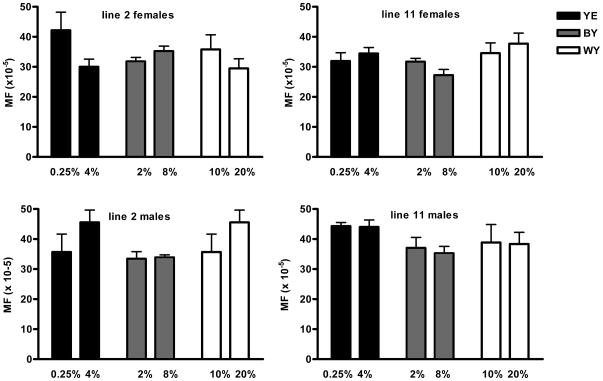
Fig. 4.
(A) Mutation frequencies after 2, 20, and 30 day adult onset (day 3) DR on Brewer’s yeast at 29°C; the only significant effect on mutation frequency was time. Two-way Anova of mutation frequencies in females and males of line 2 on Brewer’s yeast indicated that time accounts for 66.45% (p<0.0001; Df=2) and 67.87% (p<0.0001; Df=2) of total variation, respectively. Diet in females accounts for 6.14 % of variation (p=0.048; Df =1) and 0.99% of variation in males (not significant; Df=1). For line 11 time accounts for 42.7% (p=0.0022; Df =2) and 49.86% (p=0.0026; Df=2) of total variation, in females and males, respectively. In this line, diet accounts for 7.64% (not significant; Df=1) and 0.34% (not significant; Df=1) in females and males, respectively. (B) Mutation frequencies after 20 day DR on yeast extract, Brewer’s yeast or whole yeast at 29°C. No significant differences in mutation frequency were observed between DR and high-yeast diets.


