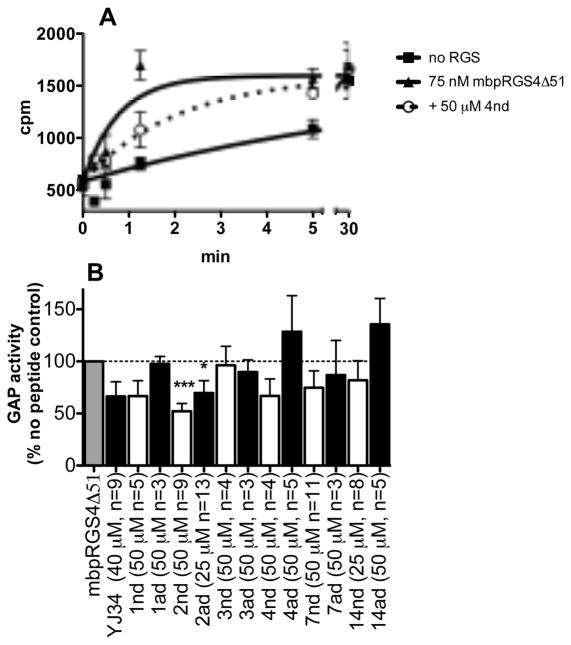
Fig. 4.
Activity of hit peptides in a single turnover GAP assay. A) Representative time course. B) Rates were calculated based on the time courses, and percent decrease in the rate of RGS stimulated GTP hydrolysis by peptides was measured (mean ± S.E.M., n ≥3). *p<0.05, **p<0.01, ***p<0.001 compared to no peptide.

