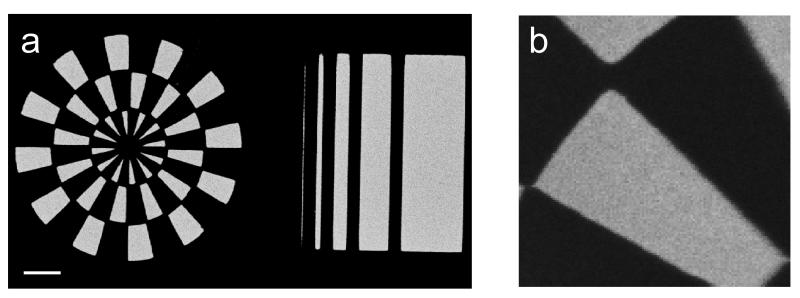
Figure 3.
Chemical imaging of protein-patterned surface chemistry. (a) Fluorescence image of a patterned surface (wheel feature is 3mm diameter) treated with solution phase streptavidin and then exposed to biotinylated BSA labeled with Alexa555. Scale bar: 500 μm. (b) Correlated PC-1 scores map of ToF-SIMS positive image from PCA treatment of the streptavidin-immobilized surface image data (image: 500 μm × 500 μm, streptavidin fragments mapped to lighter regions).

