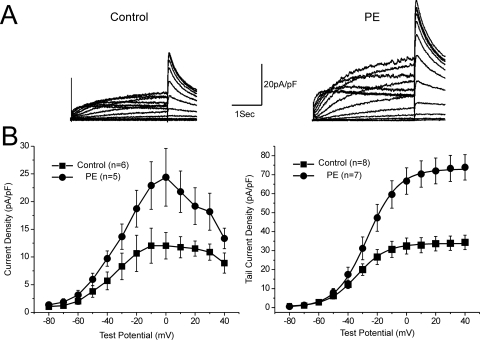
Fig. 2.
α-Adrenergic augmentation of HERG potassium current density. A, traces show representative current traces from HEK cells stably expressing HERG in response to a series of depolarizing voltage steps. Left, traces from untreated cells; right, traces from a cell expressing the α-adrenergic receptor and treated with phenylephrine for 24 h. B, bottom left, graph showing the isochronal current-voltage relationship during the depolarizing steps (with current normalized to cell capacitance). Bottom right, graph showing the voltage-dependent activation curves as measured at the maximal tail current (normalized to cell capacitance) plotted against the preceding depolarizing step voltage.

