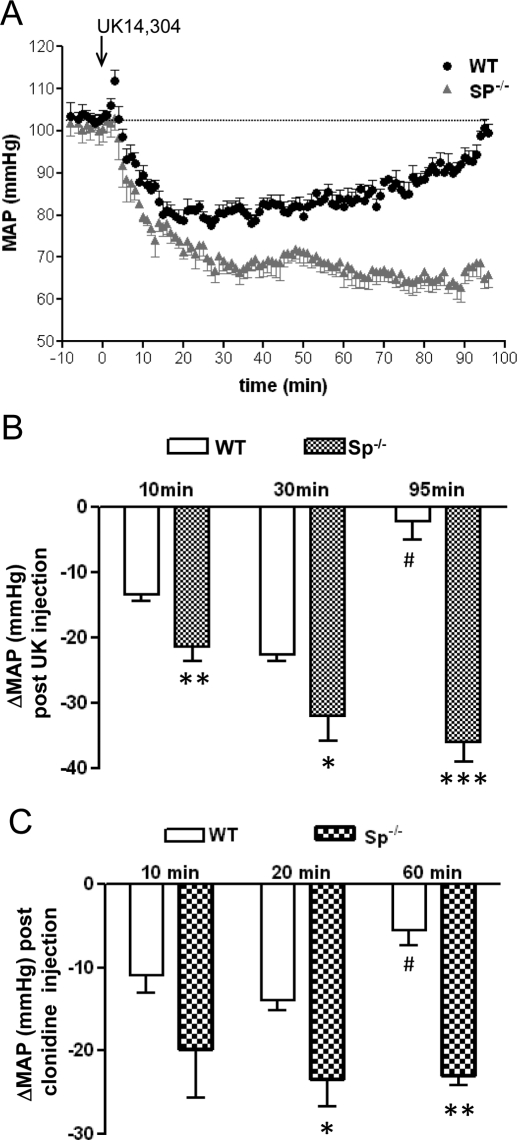
Fig. 2.
Enhanced and prolonged hypotensive effects are observed in response to α2-agonists in Sp(−/−) mice. A, mean arterial pressure (MAP) was measured in WT and Sp(−/−) mice after injection of UK14,304 (0.1 mg/kg i.v.). B, change in MAP after bolus injection of UK14,304 at the indicated times in WT and Sp(−/−) mice. Values represent mean ± S.E.M. ∗, p < 0.05; ∗∗∗, p < 0.001, comparing Sp(−/−) with WT mice at the same time point. #, p < 0.01, comparing WT at 90 min with WT at 35 min. n = 5 for each genotype. C, change in MAP after bolus injection of clonidine (0.1 mg/kg) at the indicated times in WT and Sp(−/−) mice. Values represent mean ± S.E.M. ∗, p < 0.05; ∗∗, p < 0.01, comparing Sp(−/−) with WT mice at the same time point. #, p < 0.05, comparing WT at 60 min with WT at 20 min. n = 4 for WT and n = 3 for Sp(−/−).

