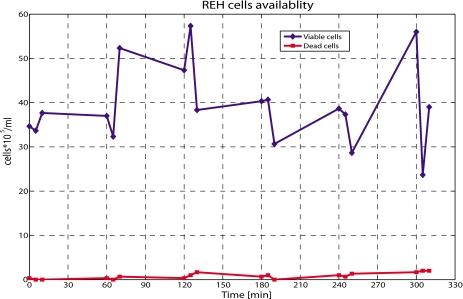
Figure 4.
Plot of cell availability with time. Test performed using the Trypan Blue exclusion assay. Cells are collected at the outlet of a microtube and quantified in triplicate every hour. Variability from 15% to 50% is obtained at every time step. On the x axis the exact time when the samples were collected is indicated.

