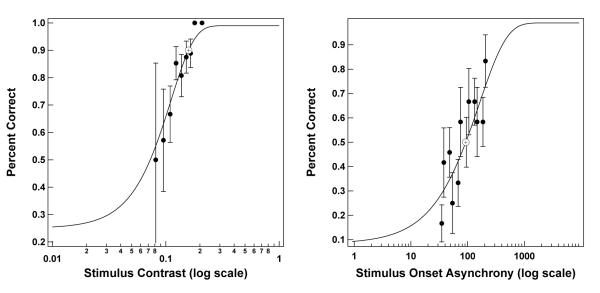
Figure 2.
Psychometric functions for various tasks, with the proportion of correct trials (where all letters were correctly identified in order) plotted for various SOA values used in each experiment. Left panel: Example psychometric function from the letter identification condition, fitting 90% thresholds as contrast is manipulated. Letter contrast is presented on a log scale. Right panel: Example psychometric function from the two-item, same location task. Error bars represent the standard error of the mean, which is given entirely by binomial variance and the number of trials at that stimulus level. The stimulus onset asynchrony is measured in milliseconds and is presented on a log scale.

