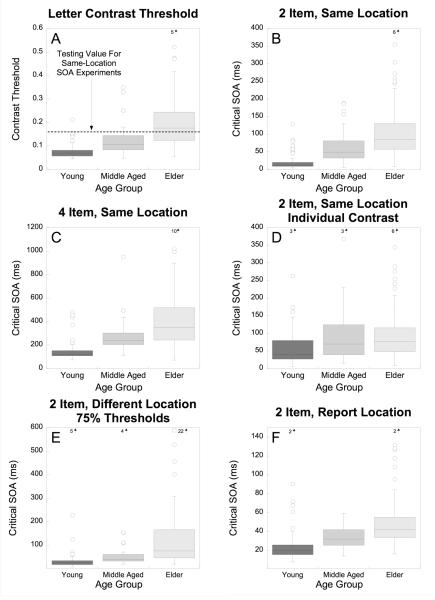
Figure 3.
Box plots of data from the three age groups for letter contrast thresholds and five measures of temporal order judgment performance. The size of the box represents the 25th and 75th percentiles, while the whiskers extend to the minimum value and a value that is 1.5 times the size of the box where there are outliers that exceed this value. Individual outliers are shown as individual points, and those that exceed a reasonable range are illustrated with arrows and the number of extreme outliers (top of each graph).

