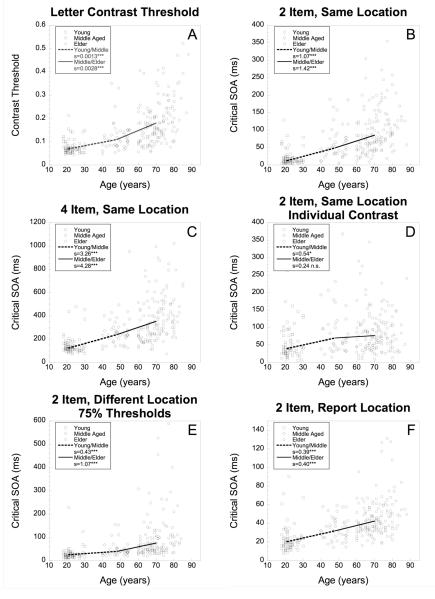
Figure 4.
Scatter plots of letter contrast threshold performance and five measures of temporal order judgment performance, plotted against participant age (N=261). Dashed lines connect the median age and median performance of young and middle-aged participants, while solid lines connect the median age and median performance of middle-aged and elder participants. The figure legend lists the slopes (abbreviated by s) of each of the associated robust regression lines for each group, along with the significance level (*** = p<0.001; * = p<0.05; n.s. = not significantly different from zero).

