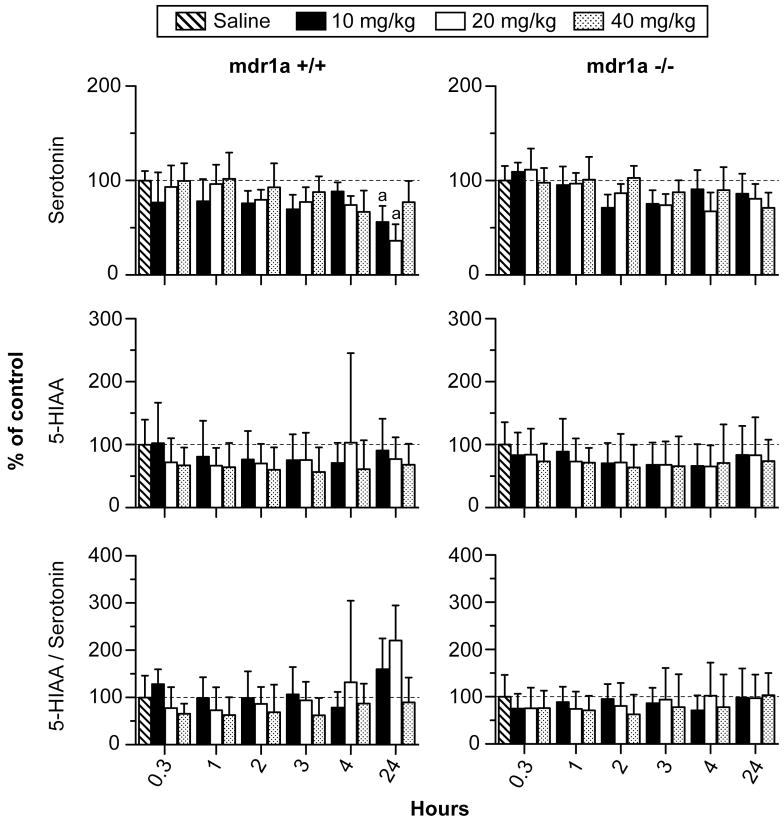
Figure 3.
Serotonin, 5-hydroxyindole-3-acetic acid (5-HIAA) and 5-HIAA/serotonin ratio in striatum of mdr1a +/+ and mdr1a −/− mice 0.3 to 24 h after 10, 20 or 40 mg/kg MDMA i.p. (n=5 for each time-point). Data are expressed as mean percent of saline control ± 95% confidence intervals. Control mice were sacrificed one h after saline administration i.p. (n=5). Post hoc comparisons for inter-strain differences: *differs from corresponding dose and time point in mdr1a −/− mice and # differs from corresponding dose and time point in mdr1a +/+ mice (p<0.0006). Post hoc comparisons for intra-strain differences: adiffers from saline control; bdiffers from 10mg/kg; cdiffers from 20mg/kg; and ddiffers from 40mg/kg MDMA (p<0.0006).

