
Figure 4.
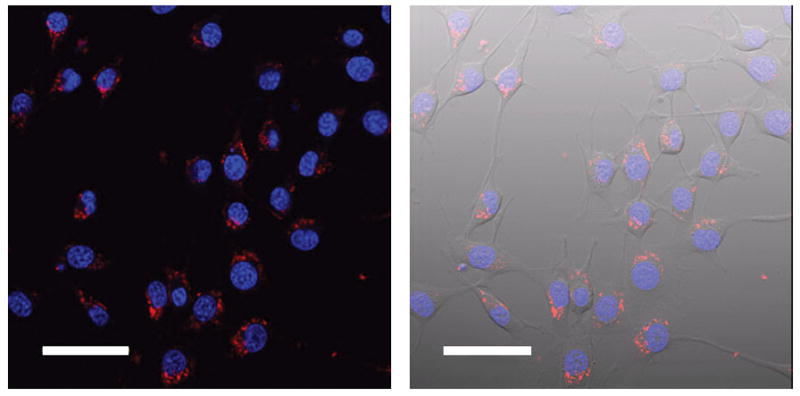
Confocal fluorescence micrographs of NIH/3T3 cells incubated with 0.2 nM particle concentration of Cy3-DNA-Gd(III)@AuNPs for 4.0 hours and a 24 hour leach in fresh media and 1 μM DAPI for 10 minutes. Left: merge of the blue (DAPI) and red [Cy3-DNA-Gd(III)@AuNPs] channels; Right: overlay, with transmitted light image. Scale bar = 50 μm