FIG. 2.

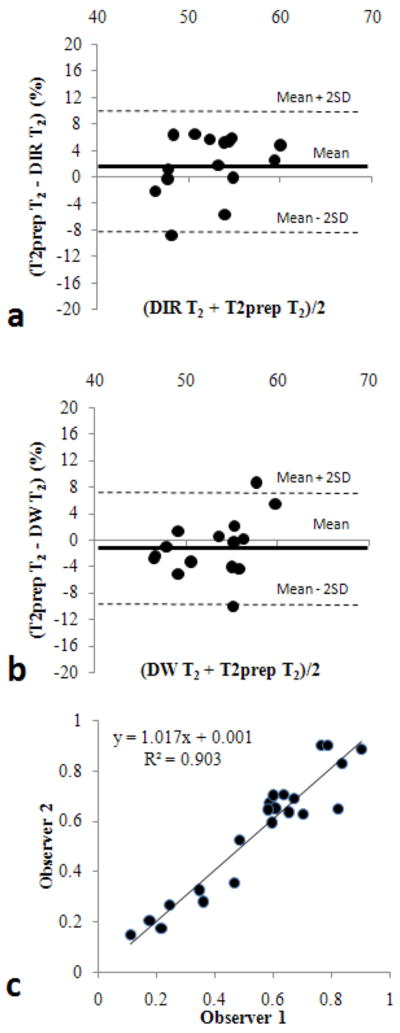
Bland-Altman plots for the comparison between T2prep and DIR measurements (a), and between T2prep and DW measurements (b). Interobserver variability in T2 measurements using DW method in all dogs is shown in (c).

Bland-Altman plots for the comparison between T2prep and DIR measurements (a), and between T2prep and DW measurements (b). Interobserver variability in T2 measurements using DW method in all dogs is shown in (c).