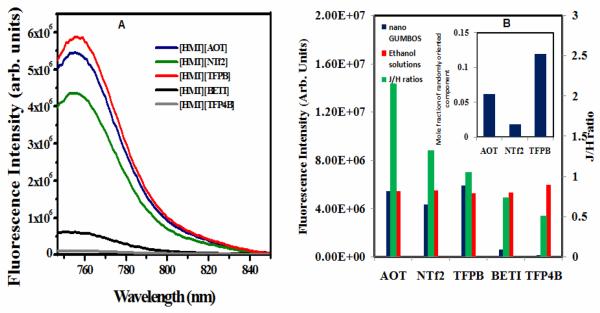
Figure 5.
(A) Fluorescence emission spectra of all the HMT nanoGUMBOS (Excitation Wavelength = 737 nm). (B) Fluorescence Intensity of (A)HMT nanoGUMBOS in water(blue), (B)HMTGUMBOS in dilute ethanolic solution (red) and (C) J/H ratio of all the HMT nanoGUMBOS(green). The inset in figure shows the molar fraction of randomly oriented component in the three highly fluorescent nanoGUMBOS calculated from absorption spectra.

