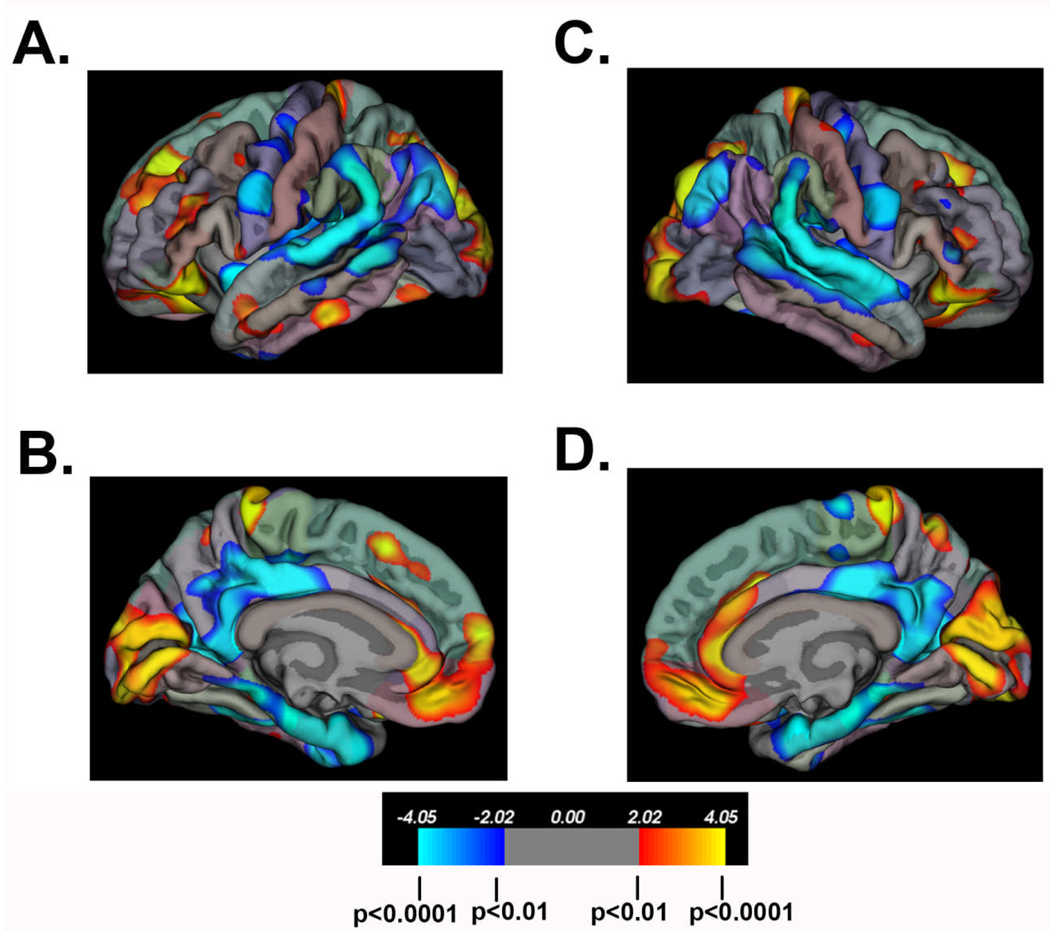
Figure 4.
Significant group differences in cortical thickness between individuals with SBM (n=74) and a comparison group of typically-developing (TD) study participants (n=31). “Hot” colors indicate cortical thickness is greater in the SBM group relative to the TD group; “cold” colors indicate cortical thickness is reduced in the SBM group relative to the TD group. Color scale bar indicates significance values (corrected for multiple comparisons) ranging from p<0.0001 to p<0.01. In frontal regions, the SBM group exhibits increased cortical thickness bilaterally in the following regions: inferior frontal, middle frontal, medial orbitofrontal, rostral anterior cingulate, and superior frontal. In bilateral inferior parietal and posterior temporal areas, the SBM group displays significant cortical thinning.

