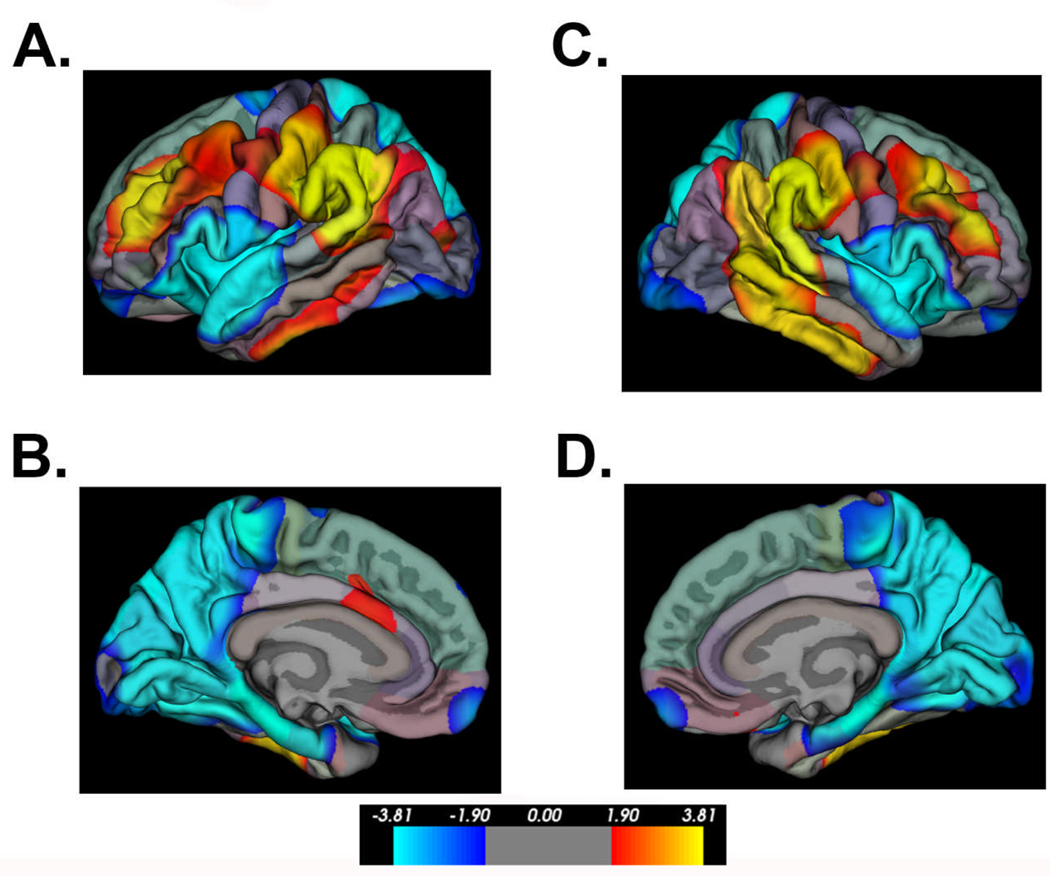
Figure 5.
Significant group differences in cortical complexity between individuals with SBM (n=74) and a comparison group of typically-developing (TD) study participants (n=31). “Hot” colors indicate cortical complexity is greater in the SBM group relative to the TD group; “cold” colors indicate cortical complexity is reduced in the SBM group relative to the TD group. In bilateral inferior parietal and posterior temporal areas, the SBM group displays significantly increased cortical complexity. In bilateral inferior frontal and orbitofrontal regions, the SBM group shows significantly reduced cortical complexity.

