Figure 1.
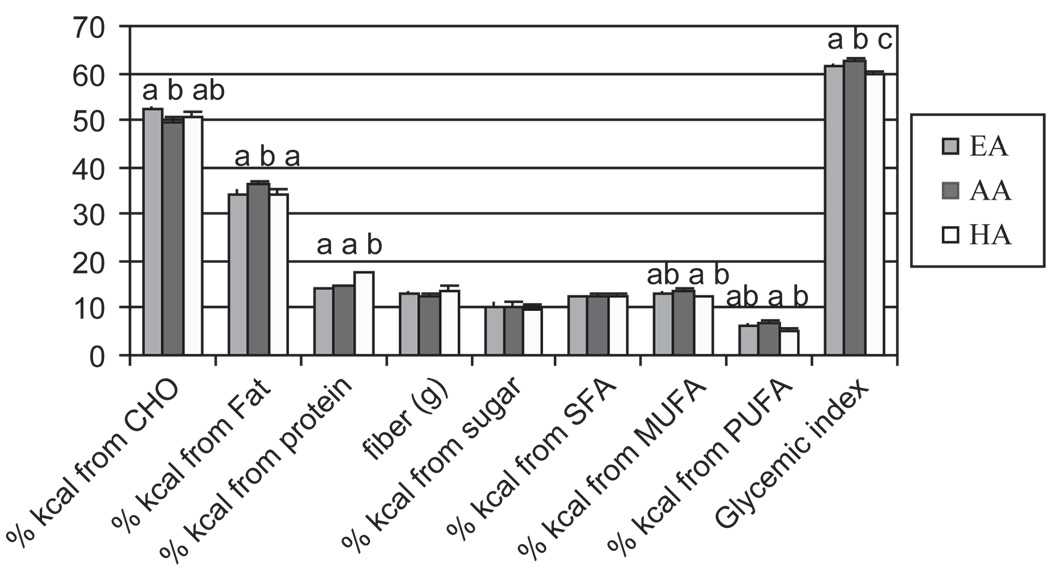
Figure 1a. Dietary intake as reported by two 24 h recalls. EA = European Americans (light gray); AA = African Americans (dark gray); HA = Hispanic Americans (white). a–cSuperscripts indicate significant differences in reported intake between racial/ethnic groups (P < 0.05).
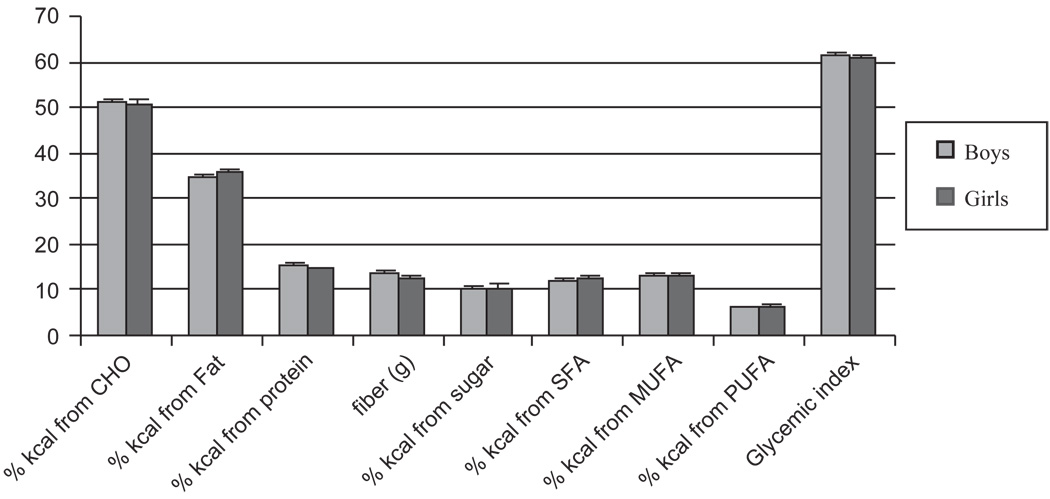
Figure 1b. Dietary intake as reported by two 24 h recalls. Boys (light gray); girls (dark gray).


