
Figure 5.
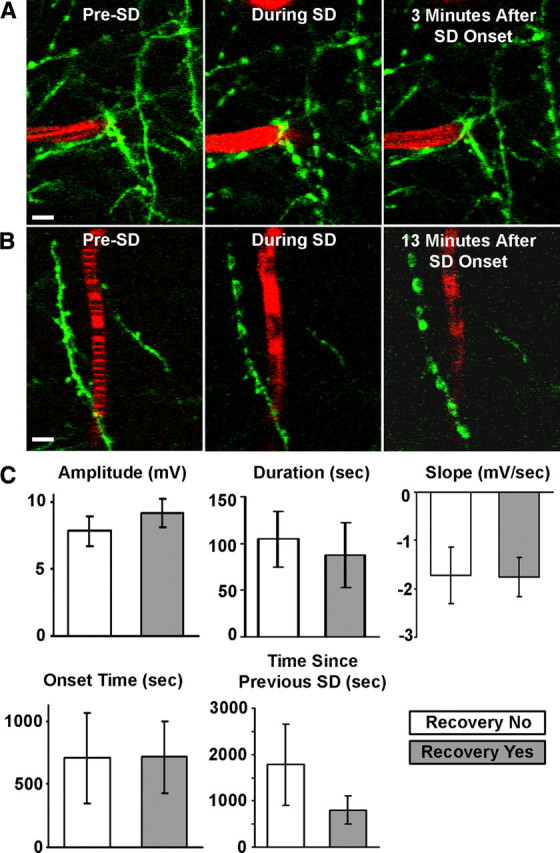
The probability of rapid (<3 min) dendritic recovery from SD-induced beading is not influenced by the quantitative features of SDs. A, 2PLSM image sequence of dendrites (green) and a capillary (red) during passage of a spontaneous SD. The dendrites appear normal, and blood flows before SD onset as indicated by striped image of capillary. The blood flow slows, and dendrites bead during a spontaneous SD. Blood flow returns and dendrites recover structurally near the capillary within minutes. Scale bar, 5 μm. B, Similar sequence as shown in A, but interruption in blood flow and dendritic beading are permanent in this example. Scale bar, 5 μm. C, Quantitative features of SDs, such as amplitude (potential difference between start of SD and the lowest point of the DC deflection), duration (time between the points corresponding to half the DC amplitude and the same potential during recovery), slope (taken from steepest 4 s segment of SD), onset time (relative to time of induced SD onset), and time since the previous SD, are not reliable predictors of rapid dendritic recovery after SD-induced beading (all graphs show mean ± SEM; p > 0.05, Mann–Whitney U test).