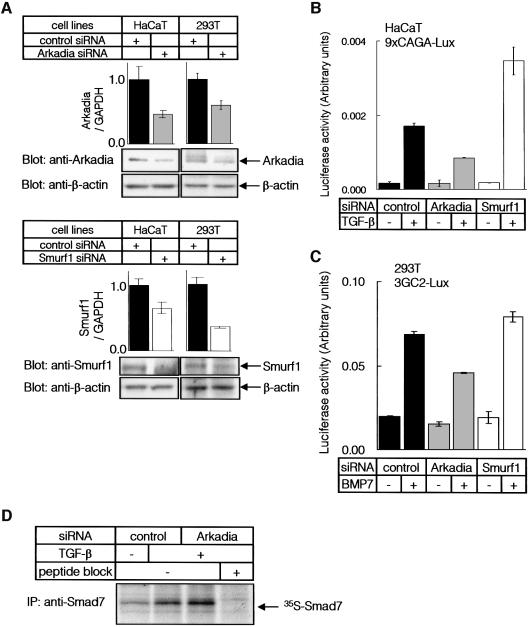
Fig. 6. Knock-down of Arkadia and Smurf1 in mammalian cells. (A) HaCaT and 293T cells were transfected with control, Arkadia or Smurf1 siRNA, and expression levels of Arkadia or Smurf1 RNAs were determined by quantitative real-time PCR analysis (top panels). Expression levels of Arkadia or Smurf1 proteins were determined by immunoblot analysis (lower panels). Expression of β-actin was determined as a loading control. (B and C) HaCaT (B) or 293T cells (C) were transfected with siRNAs and promoter–reporter constructs as indicated. Cells were treated with TGF-β (0.3 ng/ml) (B) or BMP7 (500 ng/ml) (C) for 24 h, and luciferase activities were measured as in Figure 1B. (D) Accumulation of Smad7 protein by knock-down of the Arkadia gene. HaCaT cells were transfected or not with Arkadia siRNA, and treated with 1 ng/ml TGF-β for 7.5 h. Endogenous Smad7 protein was immunoprecipitated after metabolic labelling of the cells. Cell lysates from equal numbers of cells were applied to each lane, and analysed by SDS–PAGE followed by autoradiography. Experiments were repeated with essentially the same results.

An official website of the United States government
Here's how you know
Official websites use .gov
A
.gov website belongs to an official
government organization in the United States.
Secure .gov websites use HTTPS
A lock (
) or https:// means you've safely
connected to the .gov website. Share sensitive
information only on official, secure websites.
