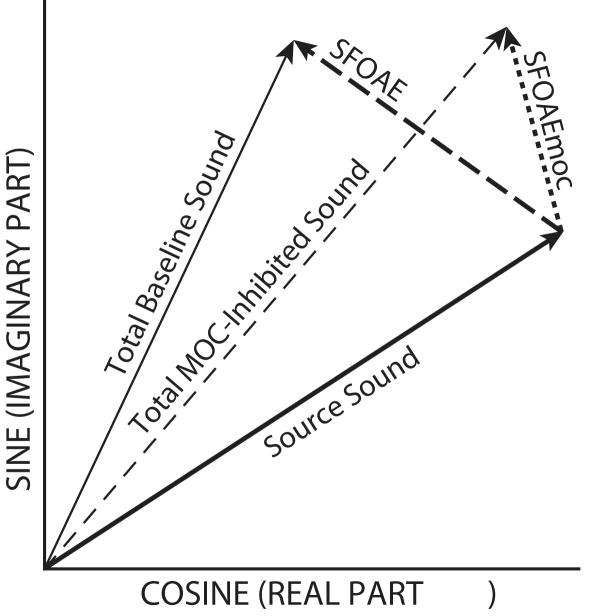
Figure 1.
Vector representation of ear-canal sound-pressure components during a stimulus frequency otoacoustic emission (SFOAE) measurement. The total baseline sound is the sum of the source sound (thick solid line) and the SFOAE (thick dashed line). The total MOC-inhibited ear-canal sound (thin dashed line) is the sum of the source sound and the SFOAEmoc (thick dotted line) which is the SFOAE during medial olivocochlear (MOC) activity.

