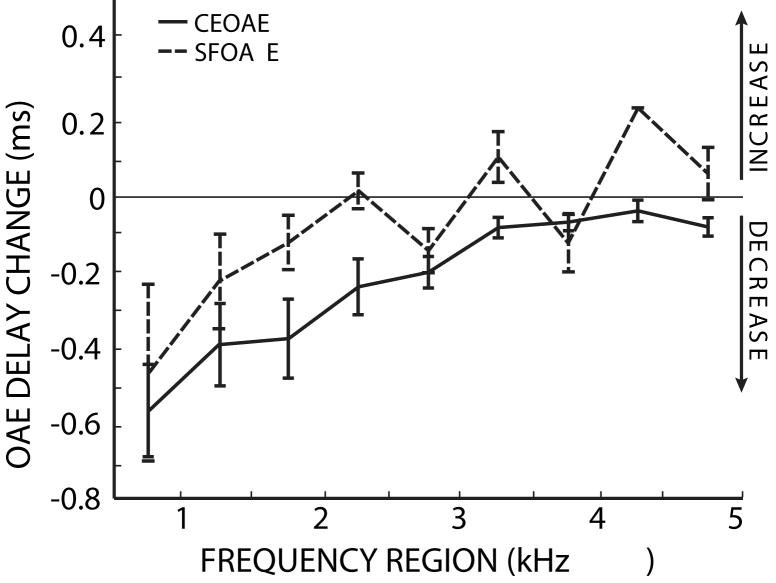
Figure 11.
SFOAE and CEOAE delay changes are both larger at low frequencies. The lines show the changes in SFOAE (dotted) and CEOAE (solid) delays due to MOC activity elicited by 60 dB SPL contralateral noise. Error bars indicate one standard error of the mean. The 4.25 kHz SFOAE bin contains only one data point. There was not a significant difference between the distributions based on OAE type (ANOVA: F= 2.78, p=0.12).

