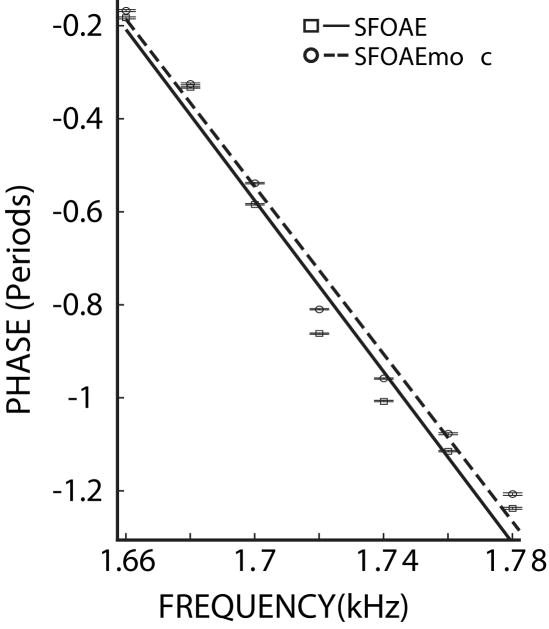
Figure 2.
SFOAE phase versus frequency plots without (□, solid line) and with (○, dashed line) MOC activity elicited by 60 dB SPL contralateral noise. The lines are linear fits to the data. The error bars (two horizontal lines at each point that are mostly indistinguishable) indicate the mean +/− two standard errors. The phase-gradient delay is the negative of the slopes of the linear fits, and is 9.2 ms for SFOAE and 9.0 ms for SFOAEmoc. Subject 208.

