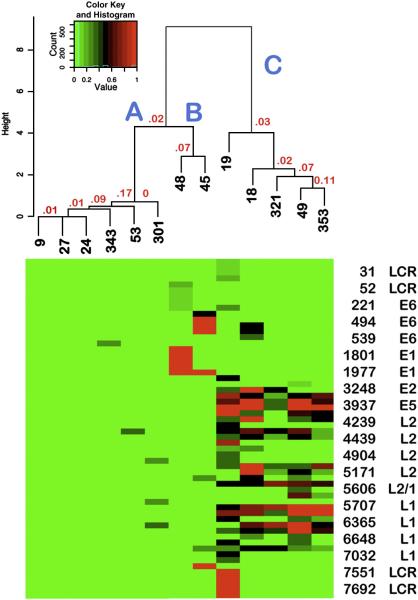
Figure 3.
Heat Map: Relationship of the thirteen HPV16 DNA methylation profiles Shown is the heat map derived by Cluster analysis and, above it, the corresponding dendrogram with the sample numbers in black and P-values in red. The original values are shown without scaling. Each branch is labeled with the corresponding HPV16 methylation pattern (A, B or C). The CpGs are shown in the same order as they occur in the HPV16 genome; every fourth CpG is listed on the y-axis. Not shown are the 52 CpGs without any methylation and the eight with partially missing data (see Supplementary Table 2).

