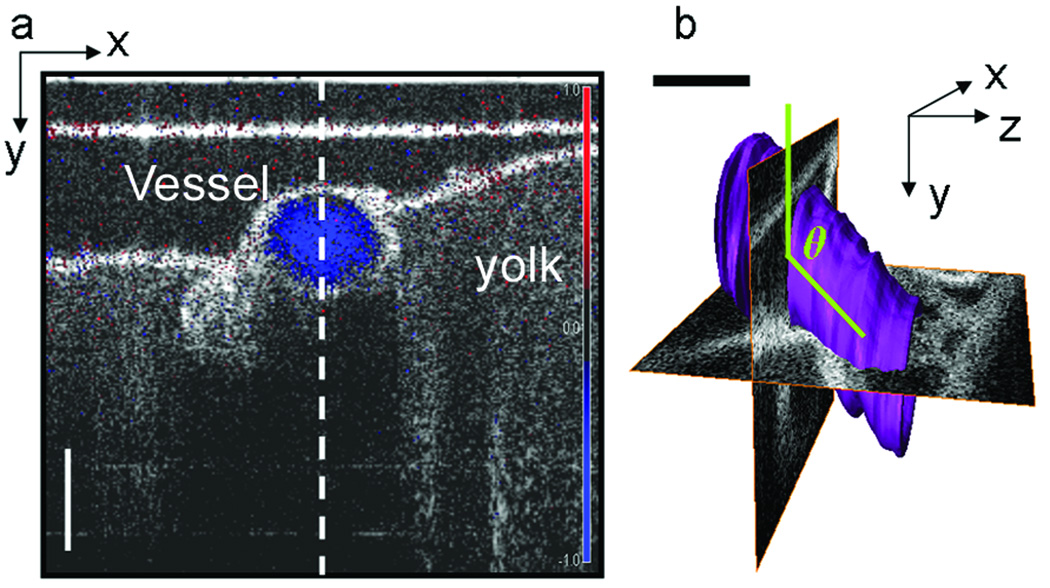
Figure 2.
SDV measurement and volume rendering of chicken embryo vessel. (a) Doppler OCT image (blue) superimposed on and SDOCT intensity image of a cross-section of Vessel 2. The vertical dotted line indicates the location SDV measurements were acquired. (b) 3D volume rendering of Vessel 2. The volume rendering is used to measure the angle of blood flow (green), relative to the OCT scanning beam. Here we have displayed two orthogonal OCT planes where the x-y plane corresponds to the image shown in (a). Scale bar = 200 µm.

