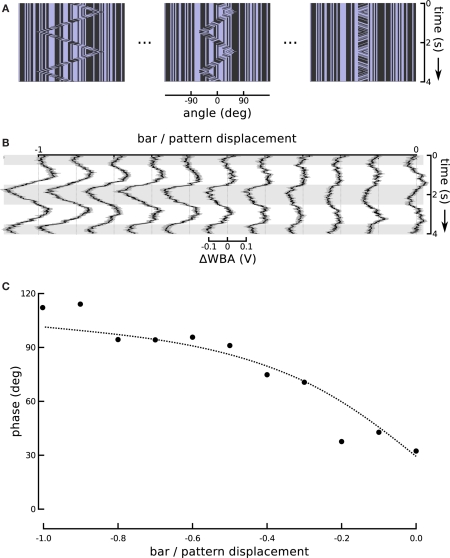
Figure 6.
Changing the motion of the bar. (A) In this series we held the internal grating motion constant, but changed the speed of bar motion (and therefore its excursion angle) in steps. A ratio of bar motion to internal pattern motion of −1 produces theta motion. The bar excursion decreases with decreasing steps in the ratio, but the internal motion remains the same. A ratio of 0 produces a stationary bar with internal grating motion, replicating the centered small field motion experiment from Figure 3. (B) The ΔWBA responses to the series of visual stimuli illustrated above. The traces change smoothly from the characteristic theta motion response to small field motion response as the gain G is varied from −1 to 0. (C) The measured and predicted phases of the ΔWBA responses to theta motion with varying gain of bar amplitude to internal motion amplitude. The points are measured phase relationships between stimuli and responses in (B), ranging from theta motion and a gain of −1, to small field motion with a gain of 0. The dotted line shows the predictions of a linear superposition model, described in the text.

