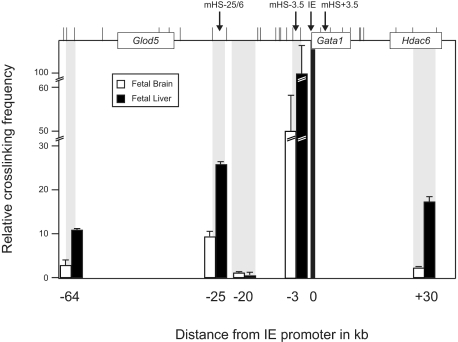
Figure 4.
Intrachromosomal interactions between elements of the Gata1 locus. Cross-linking frequencies were determined using EcoRI-digested, fixed chromatin from E14.5 fetal livers (black bars) and fetal brains (white bars). Top of the figure is a schematic representation of the Gata1 locus with genes as boxes (Glod5, Gata1, and Hdac6). Cis-regulatory elements are indicated with arrows and vertical bars indicate EcoRI restriction sites. The figure shows relative cross-linking frequencies, as an indication of proximity, between various elements of the locus (gray bars) and the IE promoter (black bar). Each PCR was performed 3 times. Error bars denote SEM. Signals were normalized as previously described.33 Coordinates (in kilobases) of the DNA fragments analyzed are indicated on the x-axis.

