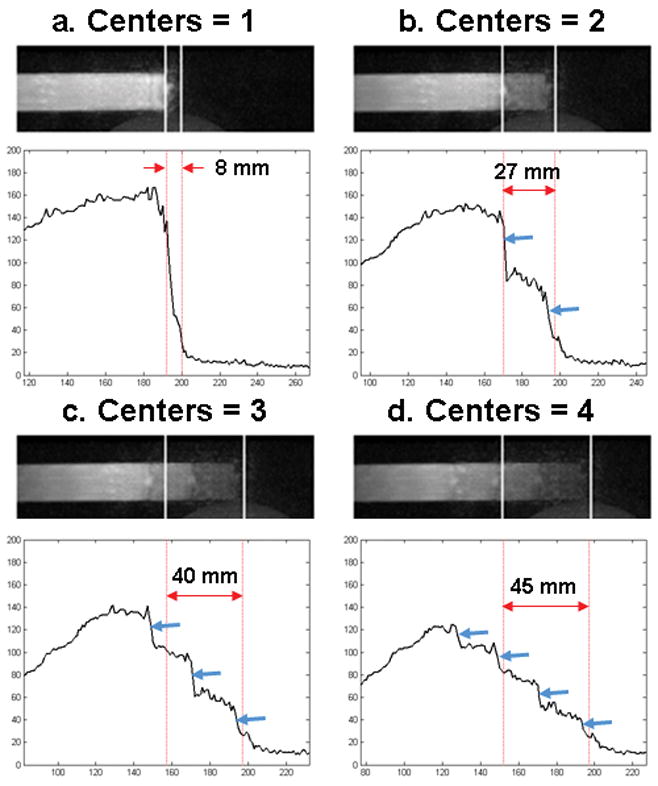
Figure 10.

A selected frame and longitudinal line profiles are shown for an EC CAPR acquisition (R = 7.3, bolus velocity 4 mm/s) that was reconstructed by averaging one (a), two (b), three (c), or four (d) k-space centers. When multiple centers are averaged there is a decrease in signal and increase in blurring of the leading edge and the appearance of multiple edges (blue arrows) in accordance with the number of centers averaged.
