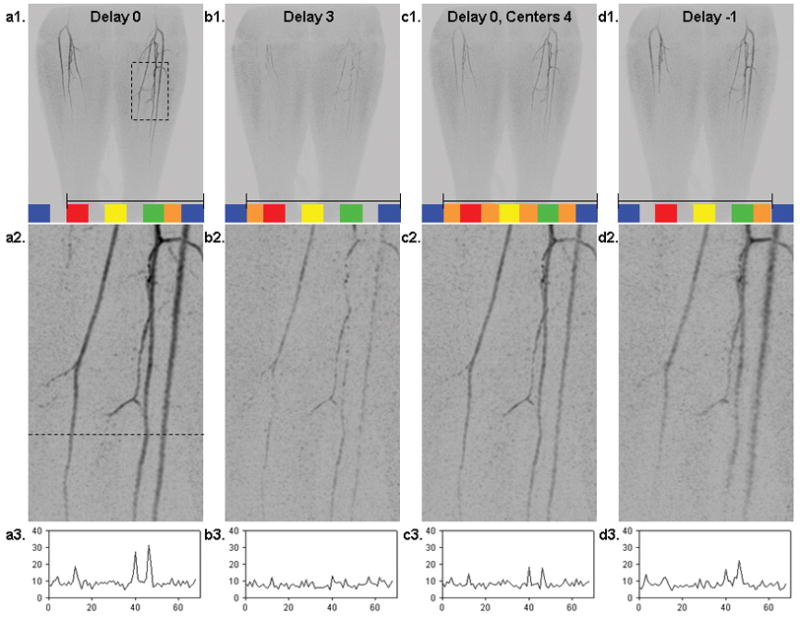
Figure 12.

A selected time frame from an in vivo study using an EC CAPR (R = 8) acquisition with data selected four different ways: (a1–a3) Delay 0 reconstruction; (b1–b3) Delay 3 reconstruction; (c1–c3) Delay 0 reconstruction but with averaging of four consecutive central samplings; (d1–d3) Delay −1 reconstruction. Parts (a1–d1) show the coronal MIP of the full 40 cm S/I FOV. Superimposed in colored blocks for each is the sampling pattern of k-space, and shown within the black bracket is the set of k-space samples used for actual reconstruction. The duration of one update, consisting of one orange and one adjacent block, is 4.9 s. Parts (a2–d2) are enlargements of the region identified in the dashed box of (a1) and were generated by 4.65× zero padding of k-space. Parts (a3–d3) are signal profiles across a line in the corresponding enlarged image, where the line is identified in (a2). The Delay 0 reconstruction with no averaging (a1–a2–a3) is the preferred method.
