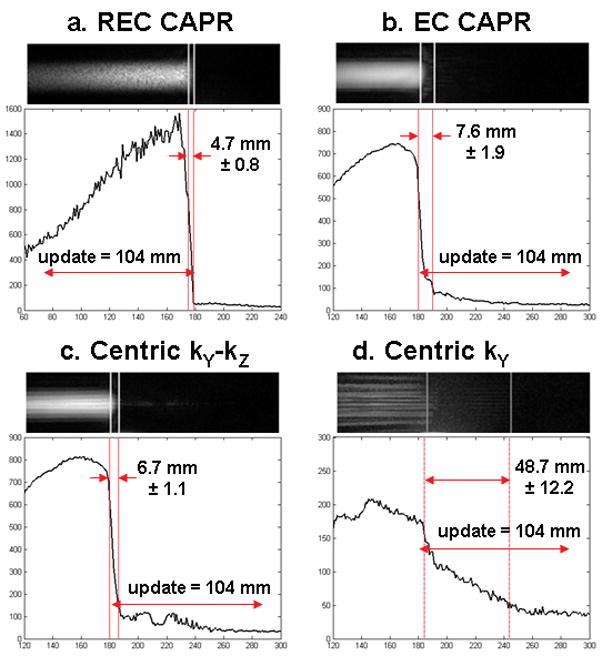
Figure 5.

A selected frame from a motion study (bolus velocity 4 mm/s) and the corresponding longitudinal line profiles are shown for the view orders (a) REC CAPR, (b) EC CAPR, (c) Centric kY-kZ, and (d) Centric kY. Motion is left to right. The vertical lines mark the 75% and 25% signal positions along the leading edge used to determine the width of the leading edge blur. Also noted is the 104 mm distance the phantom travels during one time frame. REC CAPR shows the sharpest leading edge and Centric kY the greatest extent of blur.
