
Figure 6.
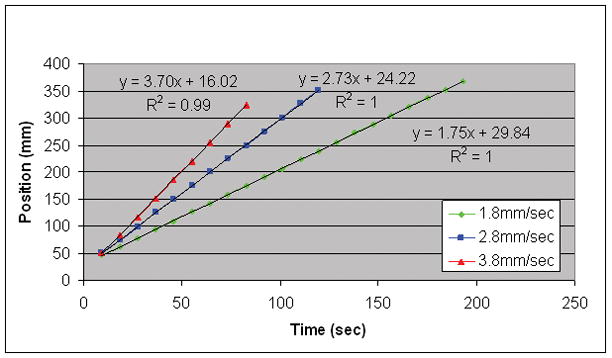
Plot of bolus leading edge position versus time for multiple consecutive time frames implementing EC CAPR at low bolus speeds. The high R2 values demonstrate how the consistency of the sampling from frame to frame provides accurate portrayal of linear motion and absolute velocity.