
Figure 9.
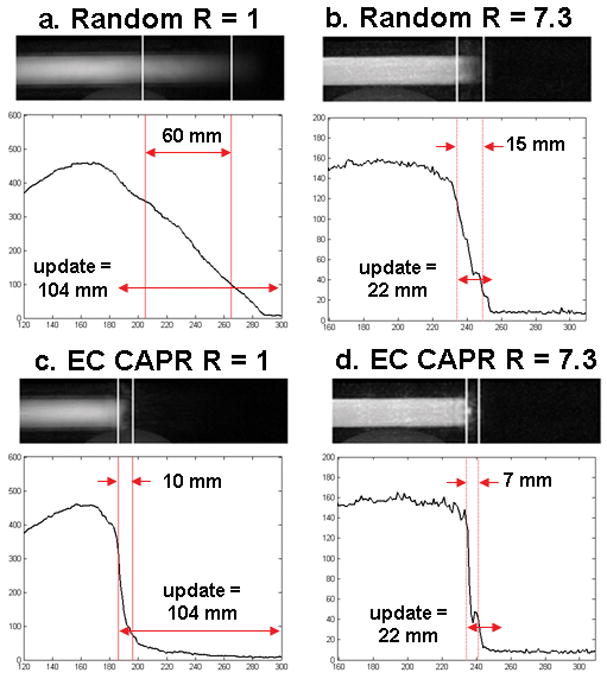
Single frame from motion studies (bolus velocity 4 mm/s) using random, (a) R=1 and (b) R=7.3, and standard EC CAPR, (c) R=1 and (d) R=7.3, sampling. Shown with each image is the corresponding longitudinal line profile. Vertical lines mark the 75% and 25% signal positions used to quantify the width of the lead edge blur. Double arrows indicate the blur width and the distance traveled by the phantom each time frame.