Abstract
Experimental myocardial infarction (MI) in mice is an important disease model in part due to the ability to study genetic manipulations. MRI has been used to assess cardiac structural and functional changes after MI in mice, but changes in myocardial perfusion after acute MI have not previously been examined. Arterial spin labeling (ASL) non-invasively measures perfusion, but is sensitive to respiratory motion and heart rate variability, and is difficult to apply after acute MI in mice. To account for these factors, a cardio-respiratory gated (CRG) ASL sequence using a fuzzy C-means algorithm to retrospectively reconstruct images was developed. Using this method, myocardial perfusion was measured in remote and infarcted regions at 1, 7, 14, and 28 days post-MI. Baseline perfusion was 4.9 ± 0.5 (ml/g·min) and one day post-MI decreased to 0.9 ± 0.8 (ml/g·min) in infarcted myocardium (P<0.05 vs. baseline) while remaining at 5.2 ± 0.8 (ml/g·min) in remote myocardium. During the subsequent 28 days, perfusion in the remote zone remained unchanged, while a partial recovery of perfusion in the infarct zone was seen. This technique, when applied to genetically-engineered mice, will allow for the investigation of the roles of specific genes in myocardial perfusion during infarct healing.
Keywords: Arterial Spin Labeling, Myocardial Perfusion, Myocardial Infarction, Fuzzy C-Means, Mouse
Introduction
Mice are widely used as models of human disease in biomedical research. Similarities in the cardiovascular systems of mice and humans, the low cost of mouse studies, the relative ease of genetic manipulation of mice, and improved surgical techniques have led to increased use of mouse models of myocardial infarction (MI)(1-3). Cardiac magnetic resonance imaging has been used to study structural and functional left ventricular (LV) remodeling in mice following MI (3-5). However, measurement of myocardial perfusion in mice by MRI during acute MI and subsequently during the processes of infarct healing and post-MI LV remodeling has not previously been performed.
Arterial spin labeling (ASL) provides quantitative measurements of blood flow, and has been used for quantification of cerebral blood flow (6,7) and myocardial perfusion (8-11) in humans. In small animals, ASL has been performed in both mice (12-15) and rats (16-25). Prior murine studies have examined myocardial perfusion at baseline (12-15), with differing anesthesia (13), in response to a vasodilator (13,15), and for phenotyping of genetically altered mice (14,15). Only two prior studies have measured perfusion after MI in mice, and those measurements were restricted only to the remote myocardium at 4 weeks following MI (12,14). ASL has been more widely used in rats (22) and has been used to assess changes in myocardial perfusion in response to dobutamine (17), adenosine (25), methods of anesthesia (23,24), diabetes (18,19) and following coronary stenosis (20,21) and MI (20,21). Similar to mouse studies, measurements of myocardial perfusion following MI in rats have been restricted to remote (20,21) and border zone myocardium (20).
The most common methodological approach to ASL in rodents uses a combination of a flow-sensitive alternating inversion recovery (FAIR) preparation scheme with an ECG-gated Look-Locker (26) acquisition method (16). For ECG-gated FAIR Look-Locker ASL, the fast heart rates of rodents facilitate a high sampling rate of the T1 relaxation curve, however, respiratory motion during image acquisition introduces significant artifact and decreases the accuracy of T1 mapping. Additionally, variable heart rates during imaging cause data to be acquired at inconsistent inversion times (TIs), introducing another source of error in measured perfusion values. Most previous ASL studies in rats attempted to minimize respiratory artifact by controlling respiration using a mechanical ventilator (17-22). However, mechanical ventilation is technically very challenging in mice, and cannot be routinely performed. Prior mouse studies used two methods for reducing the impact of respiratory artifact. In one study the respiratory interval was assumed to be constant, and images in which respiratory artifact was visually identified were manually removed prior to T1 mapping (13). A separate pair of studies used velocity-compensated gradients, signal averaging, and higher levels of isoflurane (12,14) in order to reduce respiratory artifact. However, these methods have limitations, as the respiratory interval is generally variable over the course of ASL data acquisition and isoflurane at higher doses is a potent vasodilator (13).
Due to the combination of erratic respiratory patterns, increased variability of the ECG, and high probability of imperfect ECG R-wave detection early after MI, ASL has not been successfully applied to mouse models of acute MI and post-MI infarct healing. To compensate for these factors, we developed a method for performing cardio-respiratory gated (CRG) FAIR Look-Locker ASL with accurate T1 estimation in free breathing mice. Using this method, we probed myocardial perfusion at baseline with and without ATL313 (a vasodilator), and over the course of infarct healing following reperfused MI in mice. CRG Look-Locker ASL enabled the measurement of myocardial perfusion in both remote and infarcted regions over this time period.
Methods
Pulse Sequence
A FAIR Look-Locker (26) ASL sequence using combined respiratory gating and ECG triggering (Figure 1), where sequence triggers (ECG & RESP) were detected only during the quiescent phase of expiration, was implemented on a 7T Clinscan MR system (Bruker, Ettlingen, Germany). The sequence used a spiral trajectory to sample k-space (27) and to reduce motion artifact from left ventricular blood. Upon detection of a respiratory-gated ECG trigger, a 5ms hyperbolic secant RF pulse was applied for magnetization inversion (Figure 1, FAIR). At subsequent respiratory-gated ECG triggers, a 15° RF pulse was applied and a time-stamped gradient-echo spiral interleaf was acquired (Figure 1, Spiral Gradient Echo), where the time stamp recorded the time from magnetization inversion to excitation. The number of images acquired during T1 relaxation for a single slice location was approximated at the start of each scan by counting the maximum number of respiratory-gated ECG triggers observed in a 5 second interval. After a delay of at least 5 seconds between inversion pulses, the pulse sequence was repeated until 3 averages of all spiral interleaves were acquired. Imaging was performed in 1 mid-ventricular short axis slice with a slice thickness of 1mm. For each complete scan, data sets were acquired using both non-selective and slice-selective (thickness = 2.5mm) adiabatic inversion pulses. Additional parameters included echo time (TE) = 0.67ms, field of view = 30 × 30 mm2, number of spiral interleaves = 87, duration of spiral readout = 2ms, and in-plane spatial resolution = 240×240μm2. This method acquires a series of successive end diastolic images of the heart at a sequence of TIs with fairly dense sampling of the T1-relaxation curve. The total measurement time was approximately 1 hour for acquisition of selective (SS) and non-selective (NS) FAIR Look-Locker image sets.
Figure 1.
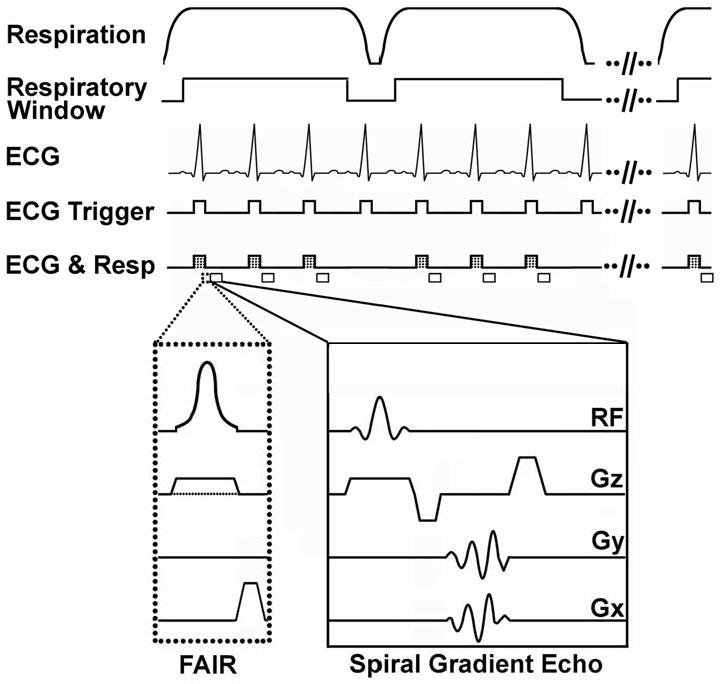
FAIR Look-Locker CRG-ASL pulse sequence with spiral gradient echo readout. Respiration and ECG were monitored during imaging, and cardio-respiratory triggers (ECG & Resp) were generated during the quiescent phase of expiration (respiratory window). Following the first CRG trigger, a FAIR inversion (dotted box) was applied. The inversion pulse can be either slice selective (solid line for Gz in the FAIR module) or non-selective (dotted line for Gz in the FAIR module). Spiral gradient echoes (solid box) were acquired after every CRG trigger for a period of 5 seconds following magnetization inversion.
Image Reconstruction
While cardio-respiratory gating reduces artifact due to heart motion and breathing, this method also results in inconsistent TIs in the acquired data. That is, using CRG data acquisition, different spiral interleafs for a given Look-Locker image will be acquired at somewhat different TIs, resulting in clusters of TIs for each Look-Locker image. To address this issue, a fuzzy C-Means (FCM) clustering algorithm (28) was used to sort and assign k-space data based on TI prior to gridding and Fourier Transform. An individual TI was assigned to each spiral interleaf using the recorded timestamp data, and all recorded TIs were stored in an array of TI values (ti). TI cluster center times (cj) were initialized as P*RR, where RR is the average cardiac interval, and P is the number of images to be reconstructed given the sequence TR and RR. Using the initialized cj, the memberships of each spiral interleaf in all TI clusters (C) were calculated using Eq. [1].
| [1] |
The membership values in uij represent the probability that a particular spiral interleaf (ti) belongs to each TI cluster (cj). The membership matrix (uij) was then used to recalculate cj using Eq. [2] from all spiral interleaves (N).
| [2] |
This process was reiterated until minimization of the following objective function (Eq. [3]):
| [3] |
If two TI cluster centers were within ½RR of each other following conclusion of the FCM algorithm, one was removed and the FCM algorithm was repeated. The final values of cj represent the TIs for reconstructed images.
The FCM algorithm allows each data acquisition to belong to multiple TI clusters with varying degrees of membership in each. Images were reconstructed using primary cluster membership, and missing interleaves, if they existed, were filled with closest matches based on secondary cluster membership values. Signal averaging was performed separately on each spiral interleaf of each cluster prior to image reconstruction. Linear B0 compensation was not implemented during image reconstruction.
Post Processing
Using Bloch equation simulations, longitudinal relaxation times, M0, and regional perfusion were estimated for regions of interest in the heart from Look-Locker CRG-ASL images. For these calculations, the effects of repeated RF excitation pulses on longitudinal magnetization have previously been accounted for by Bloch-equation modeling with a constant period between RF pulses (29). In CRG-ASL, the time between RF excitation pulses can vary as demonstrated in Figure 1 (ECG&Resp). To account for this variability, a modification of the method described by Günther et al. (29) was used where Bloch-equation modeling incorporated variable intervals between RF pulses by using FCM determined TIs, as well as a repeated pattern of ECG&Resp triggers that approximated the actual ECG and respiratory waveforms during scanning. Using an algorithm developed in MATLAB (Mathworks, Natick, Massachusetts), the behavior of longitudinal magnetization was simulated for seven repetitions of the imaging sequence, after which simulated transverse magnetization was calculated. The best fit for T1 and Mo values was determined by an exhaustive search that minimized the root mean squared error between Bloch equation simulations and measured NS and SS data. Although data were acquired immediately following inversion, the best fit was calculated only for time points beyond TI = 500ms in order to allow time for inflow of blood and water exchange. Candidate T1 values varied from 0.8 to 2 seconds. Steady state longitudinal magnetization (MZSS) was calculated from the final Look-Locker image, and Mo was allowed to vary from MZSS to 1.4*MZSS. Inversion efficiency was assumed to be 100%, and flip angle was assumed to be constant. After estimation of T1 values, myocardial perfusion (P) was calculated in units of ml/g·min according to (22,30) as:
| [4] |
T1,blood was calculated as the mean blood pool T1 over all baseline acquisitions (n = 7), and the partition coefficient (λ) was 0.95 (13). In calculating the T1 of blood, the assumption was made that blood experienced only one excitation pulse before leaving the LV. At baseline perfusion was measured over the entire myocardium, and following MI perfusion was measured in infarcted and noninfarcted regions of interest as defined by delayed signal enhancement with gadolinium-diethylenetriamine pentaacetic acid (Gd-DTPA).
Phantom Validation
In order to verify that T1 could be accurately quantified from CRG-ASL data which are acquired with inconsistent TIs, experiments were performed using a water phantom and different triggering conditions. Specifically, a stationary water phantom was imaged using (A) a fixed interval of 100ms between images, (B) an ECG recorded from a mouse under anesthesia after MI, and (C) CRG from the same mouse. A non-selective inversion was applied, and all imaging parameters were the same as above with the exception of 50 spiral interleaves and 4 averages. For acquisitions A and B, 49 images were acquired and TI was assigned prospectively based on the average interval (100ms and 105ms, respectively). For acquisition C, 37 acquisitions were collected due to CRG and 49 images were reconstructed. TI values were assigned retrospectively based on FCM results. Image analysis was performed as previously described, except that in cases A and B the respiratory interval was not included in T1 estimation.
Evaluation of CRG-ASL in Mice
We evaluated CRG-ASL in normal mice at 10 ± 1 weeks of age at rest and with a vasodilator and one day post-MI. Seven wild-type male C57BL/6 mice (Jackson Laboratory, Bar Harbor, Maine, USA) were studied under protocols that conformed to the Declaration of Helsinki as well as the Guide for Care and Use of Laboratory Animals (NIH publication no. 85-23, revised 1996) and were approved by the Animal Care and Use Committee at our institution. Assessment of baseline myocardial perfusion was performed using CRG-ASL as described above. After baseline ASL imaging, an intraperitoneal (IP) bolus injection of ATL313 (12.5 μg/kg body weight) (Adenosine Therapeutics, Charlottesville, Virginia, USA) was delivered and CRG-ASL measurements were repeated. At least 1 week later, in six mice MI was induced with a 1 hour occlusion of the left anterior descending (LAD) coronary artery followed by reperfusion as previously described (4), and imaging was performed one day later.
Measurement of Perfusion During Infarct Healing
Prior histological studies measuring blood vessel density in vitro in mice have demonstrated time-varying neovascularization in infarcted myocardium during infarct healing (1 to 28 days post-MI) (31). We hypothesized that CRG-ASL would detect changes in perfusion in the infarct zone over this period that would reflect known patterns of neovascularization. To test this hypothesis, CRG-ASL was performed one, seven, and fourteen days, and four to five weeks following MI, as was MRI of myocardial structure, function, and infarction.
Cardiac Magnetic Resonance Imaging Preparation
Mice were positioned prone within the MR scanner, body temperature was maintained using circulating thermostated water and anesthesia was maintained using 1.25% isoflurane in O2 inhaled through a nose cone. A 30mm diameter cylindrical birdcage radiofrequency coil (Bruker, Ettlingen, Germany) was used, and heart rate (HR), respiration and temperature were monitored during imaging using a fiber optic, MR compatible system (Small Animal Imaging Inc., Stony Brook, NY, USA). Global LV structure and function were assessed using a black blood cine technique as previously described (15,32). CRG-ASL was performed in one mid-ventricular short-axis slice. In our mouse model of MI using a 1-hour LAD occlusion, this slice nearly always includes large regions of both infarcted and noninfarcted myocardium. To image infarct size one day post-MI, after CRG-ASL, mice received an IP bolus injection of 0.5mmol/kg Gd-DTPA and a multi-slice inversion recovery pulse sequence with a TI of 550ms was used as previously described (4). Infarct size was measured using custom built software in MATLAB, with infarcted regions identified as areas of hyper-enhancement greater than 3 standard deviations above the mean remote myocardial signal intensity. Infarct size is expressed as a percentage of total LV mass (33).
Statistical Analysis
Statistical analysis was performed using SigmaStat (Systat Software Inc., Point Richmond, CA, USA) with one way repeated measures ANOVA assuming compound symmetry. Probability level of P < 0.05 was defined as the level necessary for statistical significance. All values in the text, tables, and graphs are presented as mean ± SEM.
Results
TI Assignment and Phantom Validation
The importance of accurate TI assignment is illustrated by analysis of the TI distribution from a CRG-ASL scan in a mouse, and T1 measurements in a phantom. A partial histogram of TIs from a baseline CRG-ASL scan in a mouse is shown in Figure 2. The specific TIs assigned to each image are shown for both prospective (circles) and retrospective (squares) TI assignment, where prospective were based on the mean manually recorded cardiac interval during image acquisition, and retrospective were calculated using the FCM algorithm. The mean residual difference of prospectively assigned image TIs compared to retrospectively assigned image TIs for all acquired data was 53.4 ± 7.0 ms at baseline, 125.0 ± 23.7 ms at baseline with ATL313, 102.2 ± 14.9 ms at day 1, 44.8 ± 10.6 ms at day 7, 44.5 ± 8.4 ms at day 14, and 70.4 ± 12.6 ms at day 28. Retrospectively assigned image TIs more accurately identify the data clusters, reducing the error associated with prospective TI assignment. With CRG-gated acquisition, TI clusters occur at fairly regular periods with no gaps during the inspiratory phase of respiration. This is due to variation in the respiratory period, resulting in the inspiratory phase occurring at different TIs throughout the scan. Results from phantom experiments with CRG gating from a live mouse further illustrate how poor ECG triggering, heart rate variability, and incorrect TI assignment translate to error in T1 measurements. Measured T1 values were (A) 1.45s (true value) using a fixed sampling interval, (B) 1.32s using live mouse ECG gating with prospective TI assignment, and (C) 1.45s using live mouse CRG with retrospective TI assignment. In reconstructing CRG-ASL images, secondary cluster membership was used for 1.1 ± 0.1% of all spiral interleaves in phantom data, and 3.1 ± 0.1% of all spiral interleaves in mice. The improved accuracy in estimating T1 using retrospective TI assignment, using the fixed sampling interval method as a standard, demonstrates the advantage of CRG-ASL with FCM image reconstruction.
Figure 2.
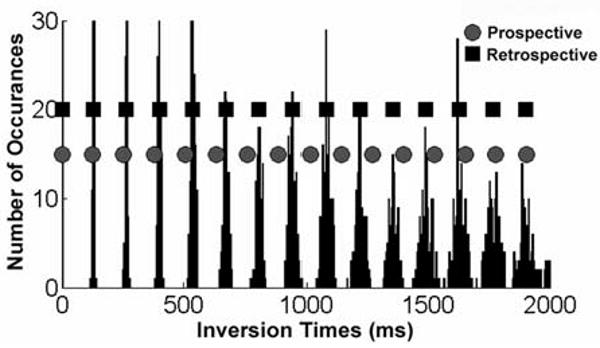
Partial histogram of the TIs of the acquired CRG-ASL data. Data were acquired for TIs up to 5000 ms, but only shown up to 2000 ms for figure clarity. The average R-R interval during the scan (prospective interval) was 128 ms (circles), and retrospective TIs were determined with FCM (squares). Retrospective TI calculation by FCM is more accurate than prospective assignment.
Evaluation of CRG-ASL at Baseline, with ATL313, and 1 Day Post-MI
Sample CRG-ASL Look-Locker images using slice-selective (SS) inversion from a mouse at multiple TIs at baseline (A-E) and one day post-MI (F-J) are shown in Figure 3. These images (A-E) demonstrate uniform T1 relaxation throughout the myocardium at baseline, reflecting uniform normal perfusion, and (F-J) regional differences in signal intensity between infarcted myocardium (white arrow) and remote myocardium (black arrow), reflecting markedly decreased perfusion in the infarcted zone and normal perfusion in the remote zone. Regional differences in T1 relaxation are quantified by examining T1 relaxation curves from SS and NS inversions at baseline, with ATL313, and one day post-MI in remote and infarcted regions as shown in Figure 4. At baseline (Figure 4A), the shift between NS and SS data reflects the T1,SS shortening effect of normal myocardial perfusion compared to T1,NS. For the data shown for this single mouse, the specific T1 values were 1.60s (NS inversion) and 1.40s (SS) corresponding to perfusion of 5.03 ml/g·min. In response to ATL313 (Figure 4B), the increased shift between NS (1.67s) and SS (1.29s) data indicates increased perfusion (10.37 ml/g·min). At one day post-MI, the shift in T1 relaxation (1.54s (NS) and 1.36s (SS)) and perfusion (4.66 ml/g·min) in remote myocardium (Figure 4C) were similar to baseline values. In contrast, a decreased T1 shift between NS (1.80s) and SS (1.75s) data in infarcted myocardium (Figure 4D) reflects a significant drop in perfusion (1.00 ml/g·min) as compared to baseline.
Figure 3.
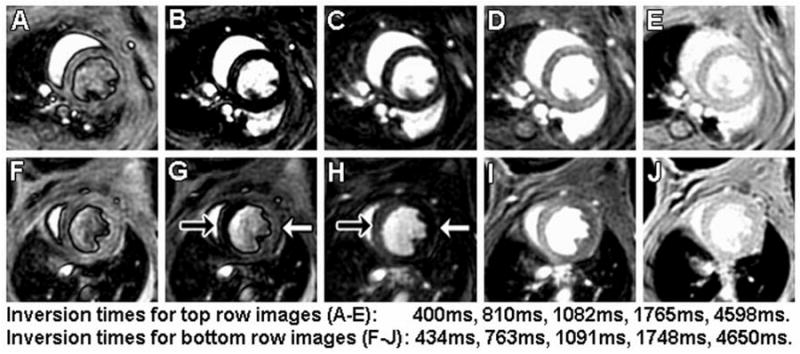
Images with slice-selective inversion acquired using CRG-ASL with FCM image reconstruction at baseline (A-E) and one day post-MI (F-J) from the same mouse. Arrows in panels G and H point to remote (black arrow) and infarct (white arrow) regions 1 day after MI. Compared to non-infarcted myocardium, a relative increase in the apparent T1 due to decreased perfusion leads to signal intensity changes in the infarct zone. The uniform intensity of myocardium in panel J indicates that differences seen in panels F-I are due to differences in T1 and not proton density.
Figure 4.
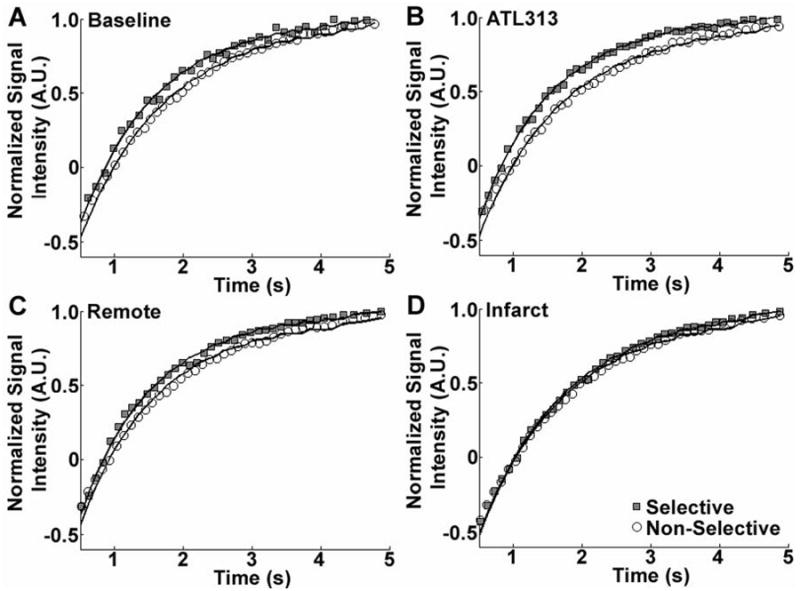
Sample T1 relaxation measurements (symbols) and best Bloch equation model fits (lines) for non-selective (NS) and slice-selective (SS) inversions at baseline (A), with ATL313 (B), and in remote (C) and infarcted (D) myocardium 1 day post-MI. The shift between NS and SS T1 relaxation data depends on tissue perfusion. Relative to baseline (A), that shift increases in response to vasodilatation with ATL313 (B), is unchanged in the post-MI remote zone (C), and decreases in infarcted myocardium (D).
Measurements of T1 using CRG-ASL averaged over all scans at baseline, with ATL313, and one day post-MI are shown in Figure 5. At baseline, with ATL313, and in remote zone myocardium, T1 was significantly shorter following selective inversion than following nonselective inversion, due to relatively high levels of myocardial perfusion. In contrast, in infarct zone myocardium, T1 following selective inversion did not differ significantly from that following non-selective inversion, reflecting very low levels of myocardial perfusion. In addition, in infarct zone myocardium, both selective and non-selective T1 values were significantly higher than non-selective T1 in all non-infarcted tissues. The longer T1 values in the infarct zone are probably due to tissue edema secondary to infarction. The T1 of blood was calculated from all baseline ASL scans as 1.62 ± 0.03s. In addition, infarct size one day after coronary ligation surgery was 43.4% ± 3.7% of LV mass.
Figure 5.
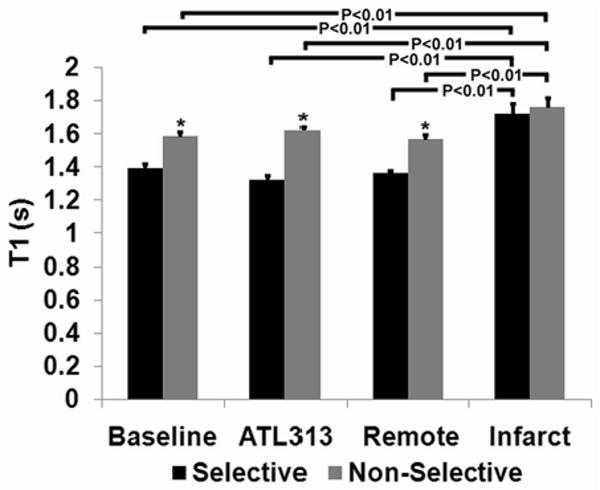
Average T1 for NS and SS inversions measured at baseline, with ATL313, and at day 1 in remote and infarcted myocardium (*P < 0.01 vs. selective). At baseline, with ATL313 and for the day 1 remote region, SS T1 is less than NS T1 due to relatively high perfusion. For the day 1 infarct region, SS T1 is not significantly less than NS T1, reflecting the relatively low perfusion in this area. Also, in the day 1 infarct region, both the SS T1 and the NS T1 are high relative to baseline values. This finding likely represents infarct-related edema in this region.
Representative T1 maps generated from baseline SS (A), baseline NS (B), day 1 SS (C), and day 1 NS (D) acquisitions are shown in Figure 6. At baseline, T1 appears relatively uniform throughout the myocardium for both SS and NS measurements, with T1 differing significantly between SS and NS acquisitions. In contrast, regional differences in T1 are seen in both the SS (C) and NS (D) T1 maps at day 1 post-MI. Specifically, T1 values in remote zone myocardium appear similar to baseline values for both SS and NS acquisitions. In contrast, similar T1 values for both SS and NS acquisitions in infarct zone myocardium result from decreased regional myocardial perfusion. Additionally, regionally increased T1 measurements for both SS and NS acquisitions reflect myocardial edema in the infarct zone.
Figure 6.
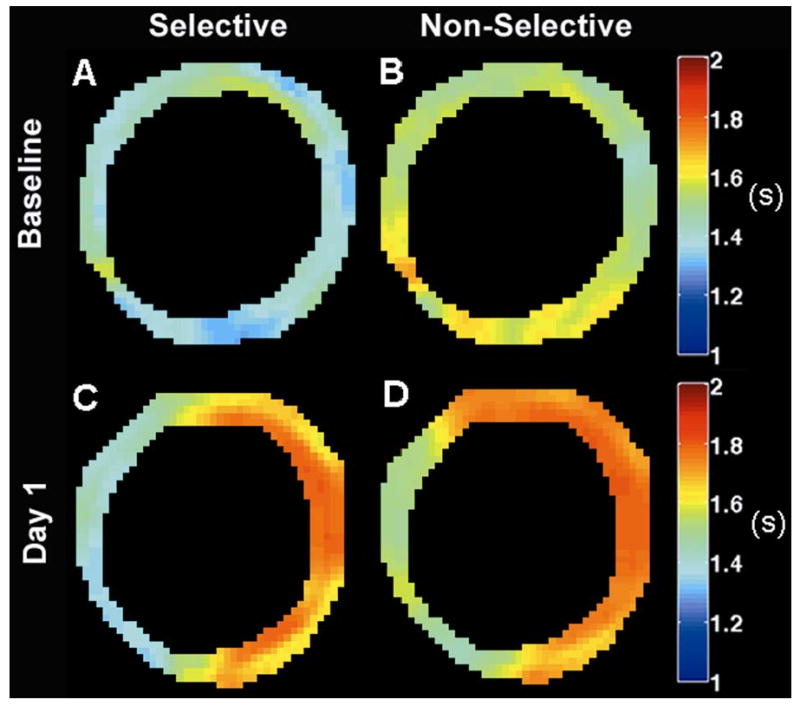
Sample T1 maps from slice-selective and non-selective CRG-ASL scans at baseline (Panels A,B) and one day post-MI (Panels C,D) demonstrate regional changes in T1 relaxation following MI due to both tissue edema and low perfusion in the infarct zone. T1 maps were smoothed using a modified mean crescent filter (36). The filter kernel was 5 pixels wide in the circumferential direction and 2 pixels wide in the radial direction.
Improved measurement of regional myocardial perfusion using CRG-ASL is illustrated by a comparison of perfusion maps generated one day post-MI using both the CRG-ASL method (Figure 7B) and using an ECG-gated acquisition with prospective image reconstruction (Figure 7C). Using CRG-ASL, a significant decrease in perfusion is seen throughout the infarcted myocardium compared to remote myocardium (Figure 7B), with the region of infarction being defined by the contrast enhanced image (Figure 7A). Compared to CRG-ASL, the perfusion defect is significantly underestimated with prospective image reconstruction (Figure 7C). With a threshold of P < 1.6 ml/g·min (chosen as the day 1 post-infarct mean + SEM) for determining significantly reduced perfusion, 81.2% ±4.1 % of voxels within the infarct zone (n=5) are classified as displaying significantly reduced perfusion using CRG-ASL. In contrast, only 32.9% ± 15.8% of voxels within the infarct zone are correctly classified as having reduced perfusion with prospective image reconstruction (n=2). Figure 8 displays measurements of perfusion by CRG-ASL at baseline, with ATL313, and in remote and infarcted regions of interest one day post-MI. CRG-ASL showed that perfusion increased significantly (P < 0.05 vs. baseline, remote and infarct) in response to vasodilatation with ATL313, while respiration and temperature were unchanged (Table 1). Perfusion in remote myocardium remained at baseline levels while it decreased in infarcted myocardium by 83% (P < 0.01 vs. baseline) one day post-MI.
Figure 7.

Sample perfusion maps generated one day post-MI. (A) Gadolinium-enhanced inversion recovery image displays hyper-enhancement of the infarcted region (arrow). (B) Perfusion map generated using CRG ASL with FCM clustering displays a perfusion defect with close spatial agreement to the infarct region as defined in (A). (C) The perfusion map generated from the same mouse using an ECG-gated acquisition with prospective TI assignment underestimated the region with reduced perfusion.
Figure 8.
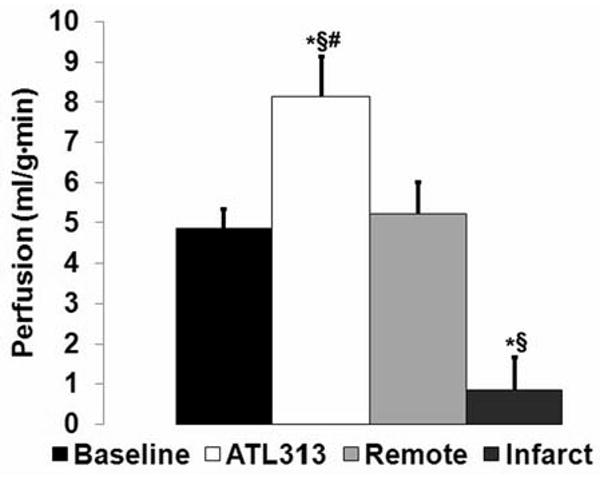
Measurements of perfusion by CRG-ASL at baseline, with ATL313, and in remote and infarcted myocardium 1 day post-MI (*P < 0.05 vs. baseline, §P < 0.05 vs. day 1 remote, #P < 0.05 vs. day 1 infarct). Myocardial perfusion increased significantly in response to ATL313, and decreased significantly in infarcted myocardium one day post-MI.
Table 1.
Physiological parameters measured during baseline scanning at rest and after injection of the vasodilator ATL313 (*P < 0.05 vs. baseline). Heart rate increased significantly in response to vasodilation with ATL313.
| Baseline | ATL313 | |
|---|---|---|
| Heart Rate (bpm) | 455 ± 13 | 634 ± 15* |
| Respiratory Interval (ms) | 427 ± 31 | 402 ± 17 |
| Minimum Respiratory Interval (ms) | 320 ± 15 | 330 ± 21 |
| Maximum Respiratory Interval (ms) | 510 ± 50 | 488 ± 21 |
| Temperature (C) | 36.3 ± 0.2 | 36.0 ± 0.4 |
Since perfusion in the skeletal muscle of the chest wall is known to be very low, it is a good close-to-zero reference. At baseline, the T1,SS of chest muscle was measured as 1.77 ± 0.08s and T1,NS was measured as 1.78 ± 0.08s, resulting in perfusion of 0.12 ± 0.19 ml/g·min. In response to ATL313 T1,SS was 1.81 ± 0.03s and T1,NS was 1.82 ± 0.03s, resulting in perfusion of 0.27 ± 0.40 ml/g·min. When measurements were repeated at 1 day post-MI, T1,SS was 1.86 ± 0.05s and T1,NS was 1.86 ± 0.04s, resulting in perfusion of 0.07 ± 0.23 ml/g·min. The differences between baseline, ATL313, and at 1 day post-MI were not significant.
Time course of Post-MI Myocardial Perfusion
The time course of perfusion in infarcted myocardium during infarct healing paralleled previously known changes in LV structure and function. Global LV function, structure and hemodynamic measurements taken following MI are shown in Table 2. Significant increases in end diastolic volume (EDV) and end systolic volume (ESV), and decreases in ejection fraction (EF) and wall thickness in infarcted myocardium reflect post-MI LV dilation and remodeling. Figure 9 displays the time course of regional perfusion at one, seven, fourteen, and twenty eight days following reperfused MI. These data show an immediate drop in perfusion in the infarct zone at day 1 post-MI, followed by increases in perfusion between one and fourteen days post-MI. Infarct zone perfusion then remains lower than both baseline and remote zone perfusion through day 28 post-MI. LV structure and global function, as assessed by EDV, ESV, and EF, also change primarily between one and fourteen days post-MI, with little change between days fourteen and twenty eight post-MI. Remote zone perfusion did not change significantly from baseline values during the course of infarct healing.
Table 2.
LV function and hemodynamic measurements during post-MI LV remodeling. Significant increases in LV volumes indicate progressive LV dilation during infarct healing. These are accompanied by decreased EF, and decreased wall thickness of infarcted myocardium (*P< 0.05 vs. Day 1, §P < 0.05 vs. Day 7).
| Day 1 | Day 7 | Day 14 | Day 28 | |
|---|---|---|---|---|
| N | 4 | 3 | 5 | 5 |
| Body Weight (g) | 21.3 ± 0.5 | 23.5 ± 0.9 | 23.6 ± 0.7 | 25.2 ± 0.8* |
| EDV (μL) | 47.4 ± 4.9 | 58.9 ± 1.3 | 71.2 ± 3.3* | 70.7 ± 4.1* |
| ESV (μL) | 29.4 ± 4.1 | 39.9 ± 2.5 | 52.4 ± 4.2* | 52.8 ± 4.1* |
| EF (%) | 38.3 ± 4.9 | 33.8 ± 3.7 | 27.3 ± 3.0* | 24.9 ± 3.3*§ |
| LV Mass (mg) | 70.2 ± 5.6 | 68.1 ± 1.9 | 73.0 ± 1.9 | 81.4 ± 2.3 |
| Remote Zone Wall Thickness (mm) | 0.84 ± 0.01 | 0.86 ± 0.04 | 0.84 ± 0.03 | 0.94 ± 0.04 |
| Infarct Zone Wall Thickness (mm) | 0.91 ± 0.03 | 0.67 ± 0.04* | 0.62 ± 0.03* | 0.61 ± 0.02* |
| HR (bpm) | 569 ± 12 | 569 ± 35 | 557 ± 18 | 567 ± 24 |
| Respiratory Interval (ms) | 606 ± 52 | 428 ± 23* | 409 ± 17* | 392 ± 34* |
| Minimum Respiratory Interval (ms) | 411 ± 53 | 388 ± 24 | 330 ± 10 | 339 ± 19 |
| Maximum Respiratory Interval (ms) | 819 ± 72 | 506 ± 31* | 487 ± 21* | 471 ± 13* |
| Temperature (C) | 35.3 ± 0.2 | 35.6 ± 0.4 | 35.9 ± 0.3 | 36.8 ± 0.3 |
Figure 9.
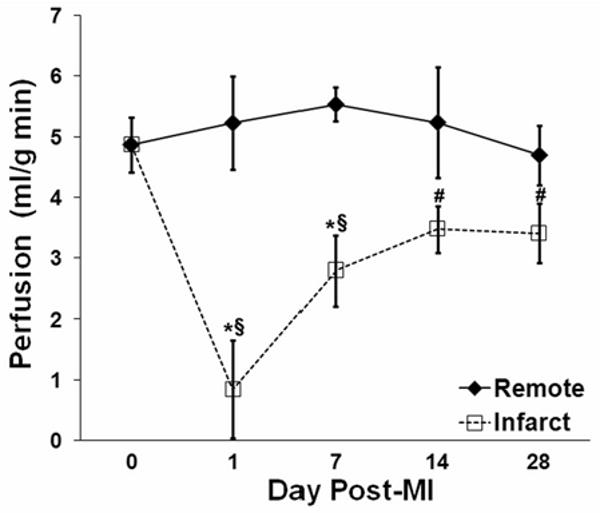
Time course of post-infarct myocardial perfusion in infarcted and remote zones. One day after MI, perfusion was very low in the infarct zone and normal in the remote zone. From day 1 to day 14, perfusion in the infarct zone increased and perfusion in the remote zone was unchanged. Symbols designate statistically significant differences (*P < 0.05 vs. remote, §P < 0.05 vs. baseline, #P < 0.05 vs. day 1 post-MI).
Discussion
CRG-ASL, which employs a FCM clustering algorithm to retrospectively reconstruct ASL images and assign image TI, was implemented to assess myocardial perfusion in mice with reduced sensitivity to erratic breathing, variable cardiac rhythm, and imperfect ECG R-wave detection, such as occur following MI. This technique improves the accuracy of T1 quantification by 1) reducing respiratory artifact, 2) sorting acquired data more accurately, and 3) using FCM to assign image TI.
CRG-ASL with FCM clustering compares favorably to prior methods for reducing respiratory artifact and the effects of poor ECG triggering. In contrast to previously described methods (12-14), CRG does not affect vascular tone or require elimination of data points within T1 relaxation curves. Additionally, prior ASL studies in mice were highly sensitive to missed ECG triggers as ASL images were reconstructed without accounting for variations in TI (12-15) and image TI was assigned either as the average TI of unsorted data (13) or as the average TI of only part of acquired data (12,14). Retrospective image reconstruction sorts acquired data based on TI, making it insensitive to variable cardiac and respiratory rates or missed ECG triggers.
The proposed method of retrospective image reconstruction is simplified by use of spiral imaging (27). In spiral imaging, each interleaf samples an equivalent range of spatial frequencies. In contrast, if data were acquired using a 2DFT method, it would be necessary to consider giving different weights to the inversion times of different lines of k-space based upon distance from the center of k-space when determining image TI. Additionally, ASL image quality is improved due to shorter TE and reduced motion artifact associated with spiral imaging. In order to reduce spiral blurring artifact due to off-resonance effects at a field strength of 7T, the duration of each spiral interleaf was set to 2ms, which is very short compared to typical durations at lower field strengths. Other k-space trajectories where each acquisition samples an equivalent range of spatial frequencies, such as radial sampling, would also be applicable and potentially more easily implemented.
Our measurements of mean baseline myocardial perfusion in mice are lower than those observed by Streif et al. (12) (7.0 ± 0.5 (SE) ml/g·min), Nahrendorf et al. (14) (6.7 ± 0.3 (SE) ml/g·min), and Kober et al. (13) (6.9 ±1.7 (SD) ml/g·min), but are higher than our previously published values (4.3 ± 0.3 (SE) ml/g·min) (15). The sensitivity of prior methods to variability in heart rate and the effect of respiratory artifact may underlie the differences between our current measurements of baseline perfusion and previously reported measurements, as these would tend to increase the measured perfusion value. The differences may also be explained by differences in anesthesia. Kober et al. (13) previously described increases in perfusion from 6.9 ml/g·min to 16.9 ml/g·min when isoflurane levels were increased from 1.25% to 2%. Higher perfusion measurements reported by others may be caused by higher isoflurane levels in two prior studies (12,14) (1.5% vs. 1.25% in our study), or by the administration of isoflurane in a 1:1 mixture of oxygen and nitrous oxide in a third study (13). A similar study performed in rat hearts showed that myocardial perfusion measured with pentobarbital increased by 25% when nitrous oxide was administered (25). Compared to our prior study (15), we observed a slight increase in baseline perfusion, and a smaller increase in response to ATL313 (8.15 ±1.0 ml/g·min vs. 11.5 ± 1.0 ml/g·min (15)). Our previous ASL method did not correct for the effects of repeated excitation pulses, potentially underestimating relaxation times and perfusion. Although this was particularly evident at baseline, our prior method was also highly sensitive to the significant and transient changes in heart rate elicited by ATL313, leading to significant prospective gating error and overestimation of perfusion with ATL313. The differences between the prior findings and those currently reported highlight the importance of retrospectively reconstructing images when heart rate is variable during data acquisition.
Comprehensive assessment of perfusion in mice during acute MI and post-MI infarct healing has not been investigated previously. Two separate studies measured perfusion at four weeks after MI in WT mice, but only in remote myocardium (3.97 ml/g·min (14) and 4.76 ml/g·min (12)). Two studies of myocardial perfusion in rats between 8 and 16 weeks post MI have found a progressive decrease in perfusion at rest and in response to adenosine in remote (20,21) and border zone myocardium (20) when compared to sham operated animals. In one study perfusion decreased from 4.13 ml/g·min at 8 weeks to 2.73 ml/g·min at 16 weeks in remote myocardium, and from 2.81 ml/g·min to 1.98 ml/g·min in border zone myocardium (20). In both studies perfusion was not measured in infarcted myocardium. Our results in mice indicate nonsignificant changes in remote zone perfusion for 4-5 weeks following MI, and these results are similar to those of one prior study (12).
Our measurements of perfusion in the infarcted region during the process of infarct healing (days 1 – 28 post-MI) may reflect neovascularization, and are consistent with findings in prior histological studies of blood vessel growth (34). Vandervelde et al. examined neovascularization in infarcted myocardium following reperfused MI in mice, reporting growth of medium and large size vessels between 4 and 14 days post-MI (31). Our measurements of perfusion in infarcted myocardium indicate recovery of blood flow between 1-2 weeks post-MI (Figure 9), possibly reflecting the growth of medium and large size vessels during this period. Despite these increases, perfusion in infarcted myocardium trended lower (P = 0.13) than baseline myocardial perfusion at 28 days post-MI. These measurements are consistent with in vivo structural and functional data demonstrating the conclusion of LV remodeling and scar formation (5,35) by this time and in vitro data regarding vascular structure in mice (31) during this time period.
Limitations of CRG-ASL are that only a single slice is acquired and that the scan time is long. Another limitation of this study is that no additional independent perfusion measurements, such as microspheres, were performed to validate the CRG-ASL technique. Additionally, since the T1 of infarcted myocardium at one day post-MI is approximately 1.8s, our results may have benefited from extending the TI range beyond 5s. However, increasing the range of TIs further would result in longer scan times.
Conclusions
The technique presented in this paper improves upon prior cardiac ASL methods in mice and develops a method for use in studying perfusion of the infarcted mouse heart that is insensitive to respiration and variable ECG triggering. This method can be used in genetically-engineered mice to examine the roles of individual genes in modulating myocardial perfusion during infarct healing.
Acknowledgments
This work was supported by American Heart Association pre-doctoral grant AHA0815242E to MHV, American Heart Association Established Investigator Award 0540060N to FHE and NIH R01 EB001763 to FHE. The authors would also like to thank Dr. Xiaodong Zhong for his expertise in pulse programming and image reconstruction.
References
- 1.Carmeliet P, Collen D. Transgenic mouse models in angiogenesis and cardiovascular disease. The Journal of Pathology. 2000;190(3):387–405. doi: 10.1002/(SICI)1096-9896(200002)190:3<387::AID-PATH595>3.0.CO;2-R. [DOI] [PubMed] [Google Scholar]
- 2.Balakumar P, Singh AP, Singh M. Rodent models of heart failure. Journal of Pharmacological and Toxicological Methods. 2007;56(1):1. doi: 10.1016/j.vascn.2007.01.003. [DOI] [PubMed] [Google Scholar]
- 3.Epstein FH. MR in mouse models of cardiac disease. NMR in Biomedicine. 2007;20(3):238–255. doi: 10.1002/nbm.1152. [DOI] [PubMed] [Google Scholar]
- 4.Gilson WD, Epstein FH, Yang Z, Xu Y, Prasad KMR, Toufektsian MC, Laubach VE, French BA. Borderzone Contractile Dysfunction Is Transiently Attenuated and Left Ventricular Structural Remodeling Is Markedly Reduced Following Reperfused Myocardial Infarction in Inducible Nitric Oxide Synthase Knockout Mice. Journal of the American College of Cardiology. 2007;50(18):1799. doi: 10.1016/j.jacc.2007.07.047. [DOI] [PubMed] [Google Scholar]
- 5.Ross AJ, Yang Z, Berr SS, Gilson WD, Petersen WC, Oshinski JN, French BA. Serial MRI evaluation of cardiac structure and function in mice after reperfused myocardial infarction. Magnetic Resonance in Medicine. 2002;47(6):1158–1168. doi: 10.1002/mrm.10166. [DOI] [PubMed] [Google Scholar]
- 6.Laar PJv, Grond Jvd, Hendrikse J. Brain Perfusion Territory Imaging: Methods and Clinical Applications of Selective Arterial Spin-labeling MR Imaging. Radiology. 2008;246(2):354–364. doi: 10.1148/radiol.2462061775. [DOI] [PubMed] [Google Scholar]
- 7.Deibler AR, Pollock JM, Kraft RA, Tan H, Burdette JH, Maldjian JA. Arterial Spin-Labeling in Routine Clinical Practice, Part 1: Technique and Artifacts. AJNR Am J Neuroradiol. 2008;29(7):1228–1234. doi: 10.3174/ajnr.A1030. [DOI] [PMC free article] [PubMed] [Google Scholar]
- 8.Fidler F, Wacker C, Dueren C, Weigel M, Jakob P, Bauer W, H A. Myocardial perfusion measurements by spin-labeling under different vasodynamic states. Journal of Cardiovascular Magnetic Resonance. 2004;6(2):509–516. doi: 10.1081/jcmr-120030571. [DOI] [PubMed] [Google Scholar]
- 9.Northrup BE, McCommis KS, Zhang H, Ray S, Woodard PK, Groplet RJ, Zheng J. Resting myocardial perfusion quantification with CMR arterial spin labeling at 1.5T 3.0T. Journal of Cardiovascular Magnetic Resonance. 2008;10(53) doi: 10.1186/1532-429X-10-53. [DOI] [PMC free article] [PubMed] [Google Scholar]
- 10.Poncelet BP, Koelling TM, Schmidt CJ, Kwong KK, Reese TG, Ledden P, Kantor HL, Brady TJ, Weisskoff RM. Measurement of human myocardial perfusion by double-gated flow alternating inversion recovery EPI. Magnetic Resonance in Medicine. 1999;41(3):510–519. doi: 10.1002/(sici)1522-2594(199903)41:3<510::aid-mrm13>3.0.co;2-g. [DOI] [PubMed] [Google Scholar]
- 11.Wacker CM, Fidler F, Dueren C, Hirn S, Jakob PM, Ertl G, Haase A, Bauer WR. Quantitative assessment of myocardial perfusion with a spin-labeling technique: Preliminary results in patients with coronary artery disease. Journal of Magnetic Resonance Imaging. 2003;18(5):555–560. doi: 10.1002/jmri.10386. [DOI] [PubMed] [Google Scholar]
- 12.Streif JUG, Nahrendorf M, Hiller KH, Waller C, Wiesmann F, Rommel E, Haase A, Bauer WR. In vivo assessment of absolute perfusion and intracapillary blood volume in the murine myocardium by spin labeling magnetic resonance imaging. Magnetic Resonance in Medicine. 2005;53(3):584–592. doi: 10.1002/mrm.20327. [DOI] [PubMed] [Google Scholar]
- 13.Kober F, Iltis I, Cozzone PJ, Bernard M. Myocardial blood flow mapping in mice using high-resolution spin labeling magnetic resonance imaging: Influence of ketamine/xylazine and isoflurane anesthesia. Magnetic Resonance in Medicine. 2005;53(3):601–606. doi: 10.1002/mrm.20373. [DOI] [PubMed] [Google Scholar]
- 14.Nahrendorf M, Streif JU, Hiller KH, Hu K, Nordbeck P, Ritter O, Sosnovik D, Bauer L, Neubauer S, Jakob PM, Ertl G, Spindler M, Bauer WR. Multimodal functional cardiac MRI in creatine kinase-deficient mice reveals subtle abnormalities in myocardial perfusion and mechanics. Am J Physiol Heart Circ Physiol. 2006;290(6):H2516–2521. doi: 10.1152/ajpheart.01038.2005. [DOI] [PubMed] [Google Scholar]
- 15.Vandsburger MH, French BA, Helm PA, Roy RJ, Kramer CM, Young AA, Epstein FH. Multi-parameter in vivo cardiac magnetic resonance imaging demonstrates normal perfusion reserve despite severely attenuated {beta}-adrenergic functional response in neuronal nitric oxide synthase knockout mice. Eur Heart J. 2007;28(22):2792–2798. doi: 10.1093/eurheartj/ehm241. [DOI] [PubMed] [Google Scholar]
- 16.Kober F, Iltis I, Izquierdo M, Desrois M, Ibarrola D, Cozzone PJ, Bernard M. High-resolution myocardial perfusion mapping in small animals in vivo by spin-labeling gradient-echo imaging. Magnetic Resonance in Medicine. 2004;51(1):62–67. doi: 10.1002/mrm.10676. [DOI] [PubMed] [Google Scholar]
- 17.Waller C, Kahler E, Hiller KH, Hu K, Nahrendorf M, Voll S, Haase A, Ertl G, Bauer WR. Myocardial Perfusion and Intracapillary Blood Volume in Rats at Rest and with Coronary Dilatation: MR Imaging in Vivo with Use of a Spin-Labeling Technique. Radiology. 2000;215(1):189–197. doi: 10.1148/radiology.215.1.r00ap07189. [DOI] [PubMed] [Google Scholar]
- 18.Waller C, Hiller KH, Rudiger T, Kraus G, Konietzko C, Hardt N, Ertl G, Bauer WR. Noninvasive Imaging of Angiogenesis Inhibition Following Nitric Oxide Synthase Blockade in the Ischemic Rat Heart in Vivo. Microcirculation. 2005;12(4):339–347. doi: 10.1080/10739680590934754. [DOI] [PubMed] [Google Scholar]
- 19.Waller C, Engelhorn T, Hiller KH, Heusch G, Ertl G, Bauer WR, Schulz R. Impaired resting perfusion in viable myocardium distal to chronic coronary stenosis in rats. Am J Physiol Heart Circ Physiol. 2005;288(6):H2588–2593. doi: 10.1152/ajpheart.01060.2004. [DOI] [PubMed] [Google Scholar]
- 20.Waller C, Hiller KH, Pfaff D, Gattenlöhner S, Ertl G, Bauer WR. Functional mechanisms of myocardial microcirculation in left ventricular hypertrophy: A hypothetical model of capillary remodeling post myocardial infarction. Microvascular Research. 2008;75(1):104. doi: 10.1016/j.mvr.2007.04.005. [DOI] [PubMed] [Google Scholar]
- 21.Waller C, Hiller KH, Kahler E, Hu K, Nahrendorf M, Voll S, Haase A, Ertl G, Bauer WR. Serial Magnetic Resonance Imaging of Microvascular Remodeling in the Infarcted Rat Heart. Circulation. 2001;103(11):1564–1569. doi: 10.1161/01.cir.103.11.1564. [DOI] [PubMed] [Google Scholar]
- 22.Belle V, Kahler E, Waller C, Rommel E, Voll S, Hiller K, Bauer W, Haase A. In vivo quantitative mapping of cardiac perfusion in rats using a noninvasive MR spin-labeling method. Journal of Magnetic Resonance Imaging. 1998;8:1240–1245. doi: 10.1002/jmri.1880080610. [DOI] [PubMed] [Google Scholar]
- 23.Iltis I, Kober F, Dalmasso C, Cozzone PJ, Bernard M. Noninvasive Characterization of Myocardial Blood Flow in Diabetic, Hypertensive, and Diabetic and Hypertensive Rats Using Spin-Labeling MRI. Microcirculation. 2005;12(8):607–614. doi: 10.1080/10739680500301607. [DOI] [PubMed] [Google Scholar]
- 24.Iltis I, Kober F, Desrois M, Dalmasso C, Lan C, Portha B, Cozzone PJ, Bernard M. Defective Myocardial Blood Flow and Altered Function of the Left Ventricle in Type 2 Diabetic Rats: A Noninvasive In Vivo Study Using Perfusion and Cine Magnetic Resonance Imaging. Investigative Radiology. 2005;40(1):19–26. [PubMed] [Google Scholar]
- 25.Iltis I, Kober F, Dalmasso C, Lan C, Cozzone PJ, Bernard M. In vivo assessment of myocardial blood flow in rat heart using magnetic resonance imaging: Effect of anesthesia. Journal of Magnetic Resonance Imaging. 2005;22(2):242–247. doi: 10.1002/jmri.20352. [DOI] [PubMed] [Google Scholar]
- 26.Look D, Locker D. Time saving in measurement of NMR and EPR relaxation times. Rev Sci Instrum. 1970;41:250–251. [Google Scholar]
- 27.Meyer CH, Hu BS, Nishimura DG, Macovski A. Fast Spiral Coronary Artery Imaging. Magnetic Resonance in Medicine. 1992;28(2):202–213. doi: 10.1002/mrm.1910280204. [DOI] [PubMed] [Google Scholar]
- 28.Fukunaga K. In: Introduction to Statistical Pattern Recognition. Rheinboldt W, editor. San Diego: Morgan Kaufmann; 1990. p. 591. [Google Scholar]
- 29.Günther M, Bock M, Schad LR. Arterial spin labeling in combination with a look-locker sampling strategy: Inflow turbo-sampling EPI-FAIR (ITS-FAIR) Magnetic Resonance in Medicine. 2001;46(5):974–984. doi: 10.1002/mrm.1284. [DOI] [PubMed] [Google Scholar]
- 30.Bauer WR, Hiller KH, Roder F, Rommel E, Ertl G, Haase A. Magnetization exchange in capillaries by microcirculation affects diffusion-controlled spin-relaxation: A model which describes the effect of perfusion on relaxation enhancement by intravascular contrast agents. Magnetic Resonance in Medicine. 1996;35(1):43–55. doi: 10.1002/mrm.1910350107. [DOI] [PubMed] [Google Scholar]
- 31.Vandervelde S, van Amerongen MJ, Tio RA, Petersen AH, van Luyn MJA, Harmsen MC. Increased inflammatory response and neovascularization in reperfused vs. nonreperfused murine myocardial infarction. Cardiovascular Pathology. 2006;15(2):83. doi: 10.1016/j.carpath.2005.10.006. [DOI] [PubMed] [Google Scholar]
- 32.Berr SS, Roy RJ, French BA, Yang Z, Gilson W, Kramer CM, Epstein FH. Black blood gradient echo cine magnetic resonance imaging of the mouse heart. Magnetic Resonance in Medicine. 2005;53(5):1074–1079. doi: 10.1002/mrm.20487. [DOI] [PubMed] [Google Scholar]
- 33.Yang Z, Berr SS, Gilson WD, Toufektsian MC, French BA. Simultaneous Evaluation of Infarct Size and Cardiac Function in Intact Mice by Contrast-Enhanced Cardiac Magnetic Resonance Imaging Reveals Contractile Dysfunction in Noninfarcted Regions Early After Myocardial Infarction. Circulation. 2004;109(9):1161–1167. doi: 10.1161/01.CIR.0000118495.88442.32. [DOI] [PubMed] [Google Scholar]
- 34.Frangogiannis NG. The immune system and cardiac repair. Pharmacological Research. 2008;58(2):88. doi: 10.1016/j.phrs.2008.06.007. [DOI] [PMC free article] [PubMed] [Google Scholar]
- 35.Yang Z, Bove CM, French BA, Epstein FH, Berr SS, DiMaria JM, Gibson JJ, Carey RM, Kramer CM. Angiotensin II Type 2 Receptor Overexpression Preserves Left Ventricular Function After Myocardial Infarction. Circulation. 2002;106(1):106–111. doi: 10.1161/01.cir.0000020014.14176.6d. [DOI] [PubMed] [Google Scholar]
- 36.Wen H, Marsolo KA, Bennett EE, Kutten KS, Lewis RP, Lipps DB, Epstein ND, Plehn JF, Croisille P. Adaptive Postprocessing Techniques for Myocardial Tissue Tracking with Displacement-encoded MR Imaging. Radiology. 2008;246(1):229–240. doi: 10.1148/radiol.2461070053. [DOI] [PMC free article] [PubMed] [Google Scholar]


