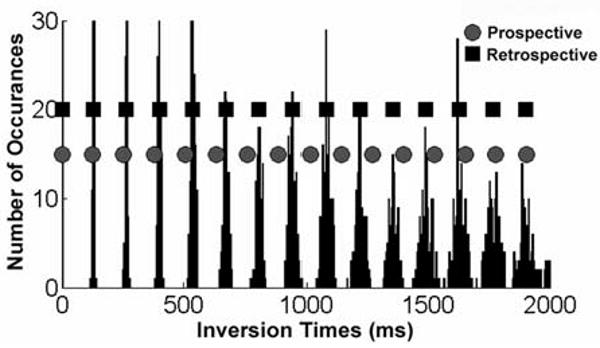
Figure 2.

Partial histogram of the TIs of the acquired CRG-ASL data. Data were acquired for TIs up to 5000 ms, but only shown up to 2000 ms for figure clarity. The average R-R interval during the scan (prospective interval) was 128 ms (circles), and retrospective TIs were determined with FCM (squares). Retrospective TI calculation by FCM is more accurate than prospective assignment.
