
Figure 6.
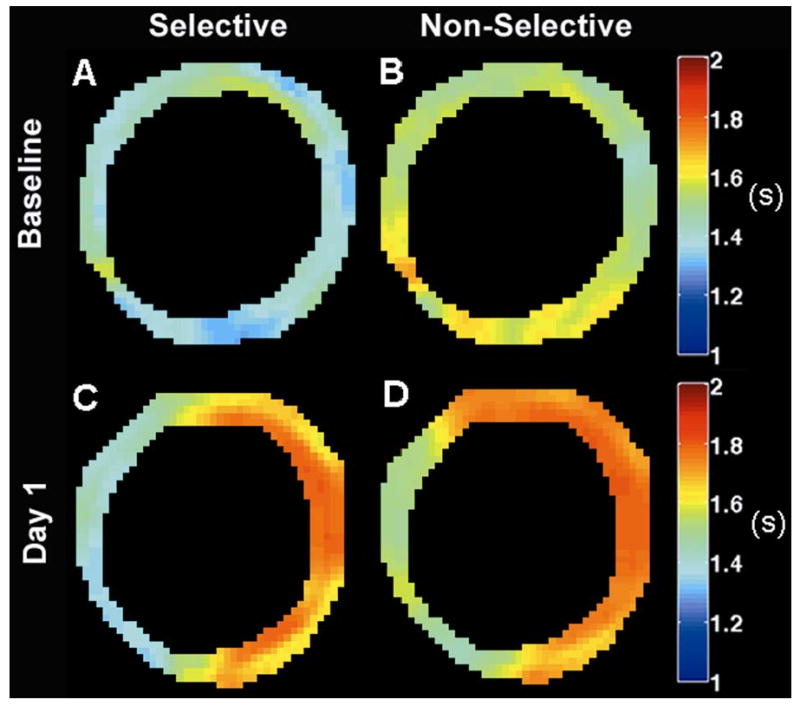
Sample T1 maps from slice-selective and non-selective CRG-ASL scans at baseline (Panels A,B) and one day post-MI (Panels C,D) demonstrate regional changes in T1 relaxation following MI due to both tissue edema and low perfusion in the infarct zone. T1 maps were smoothed using a modified mean crescent filter (36). The filter kernel was 5 pixels wide in the circumferential direction and 2 pixels wide in the radial direction.