
Figure 9.
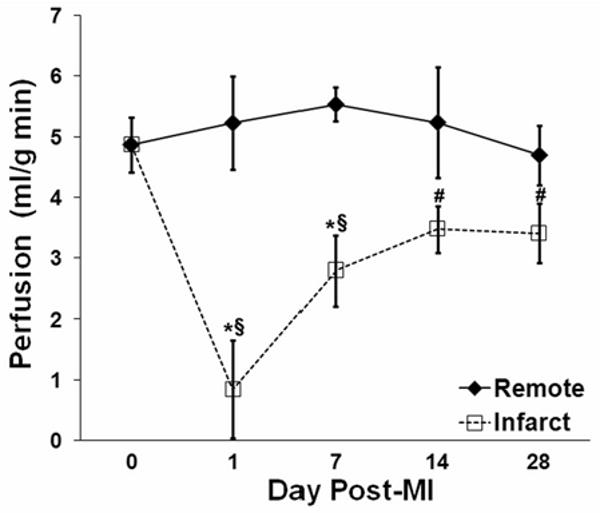
Time course of post-infarct myocardial perfusion in infarcted and remote zones. One day after MI, perfusion was very low in the infarct zone and normal in the remote zone. From day 1 to day 14, perfusion in the infarct zone increased and perfusion in the remote zone was unchanged. Symbols designate statistically significant differences (*P < 0.05 vs. remote, §P < 0.05 vs. baseline, #P < 0.05 vs. day 1 post-MI).