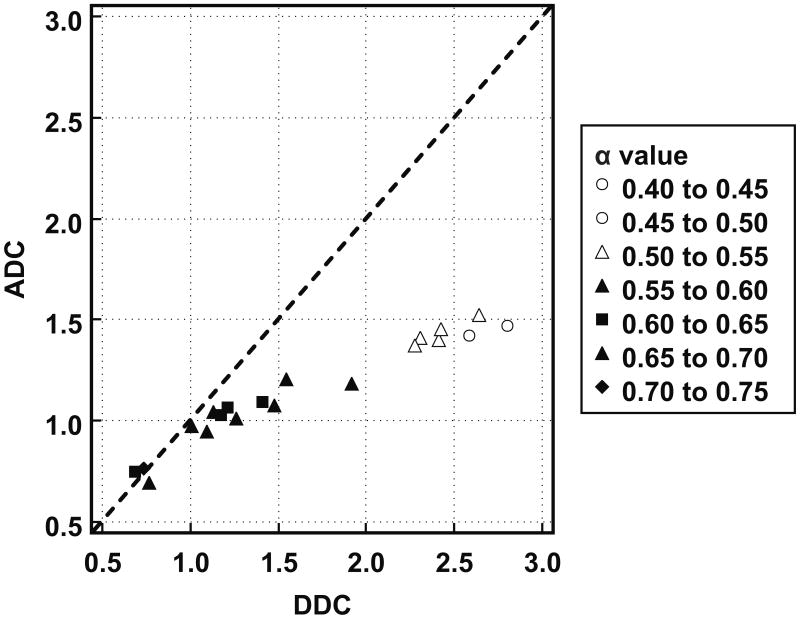
Figure 1.
Scatter plot with tumor DDC (in 10-3 mm2/s) (x-axis) against ADC (in 10-3 mm2/s) (y-axis) and line of unity (dashed line). Correlation between tumor ADC and DDC was strongly positive (R = 0.9716; P < 0.0001). However, note that the plotted data deviate from the line of unity, suggesting overall poor agreement between tumor ADCs and DDCs. Nevertheless, note that agreement between tumor ADCs and DDCs is dependent on the magnitude of measurements, with a good agreement at low ADCs/DDCs, and a poor agreement at high ADCs/DDCs. Also note that as DDC increases, the α value decreases, and that lower α values correspond to a poorer agreement between ADC and DDC.

