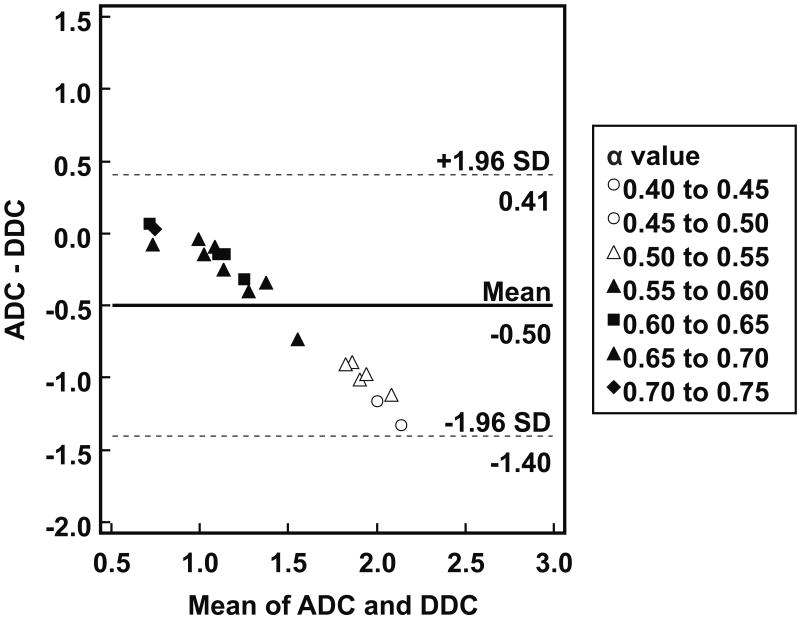
Figure 2.
Agreement between tumor ADCs and DDCs. Bland-Altman plot of difference between ADC and DDC (in 10-3 mm2/s) (y-axis) against mean of ADC and DDC (in 10-3 mm2/s) (x-axis), with mean absolute difference (bias) (continuous line) and 95% confidence interval of the mean difference (limits of agreement) (dashed lines). Note that agreement between tumor ADCs and DDCs is dependent on the magnitude of measurements, with a good agreement at low ADCs/DDCs, and a poor agreement at high ADCs/DDCs. Also note that as DDC increases, the α value decreases, and that lower α values correspond to a poorer agreement between ADC and DDC.

