
Figure 4.
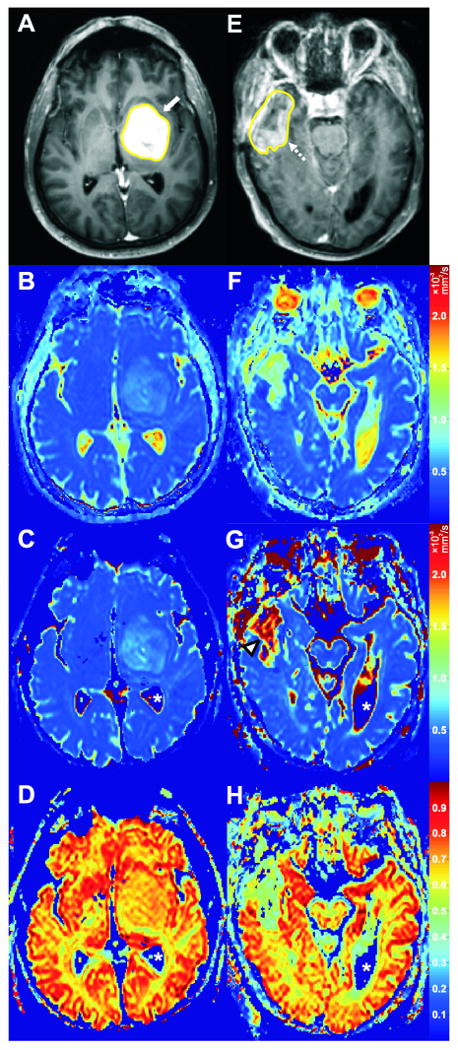
Two cases with good and poor agreement between ADC and DDC, respectively. Case 7 (Table 1); a 56-year-old male with a high-grade glioma (WHO grade IV) in the left frontal and temporal lobes (A-D). Axial post-gadolinium T1-weighted image with tumor VOI (A) clearly shows the enhancing tumor (white arrow). ADC, DDC, and α value of the tumor on corresponding axial ADC (B), DDC (C), and α (D) maps were 1.17 × 10⁻³ mm2/s, 1.13 × 10⁻³ mm2/s, and 0.68, respectively. The relatively good agreement between tumor ADC and DDC, and the relatively high α value of this tumor are well visualized (B, C, D). Case 9 (Table 1); a 69-year-old male with a high-grade glioma (WHO grade IV) in the right temporal lobe (E-F). Axial post-gadolinium T1-weighted image with tumor VOI (E) shows the enhancing part of the tumor (dashed arrow). ADC, DDC, and α value of the tumor on corresponding axial ADC (F), DDC (G), and α (H) maps were 1.45 × 10⁻³ mm2/s, 2.41 × 10⁻³ mm2/s, and 0.42, respectively. The poor agreement between tumor ADC and DDC is well visualized (F, G), with DDC being considerably higher (G, arrowhead). The relatively low α value of this tumor is also well visualized (H). It should be emphasized that α maps are completely different from ADC or DDC maps, because the former show intravoxel diffusion heterogeneity of tissues whereas the latter can only provide information on the intervoxel diffusion heterogeneity of tissues. Also note that the apparent “zero” DDCs and α values of the cerebrospinal fluid (C, D, G, H, white asterisks) are only a result of noise thresholding – these pixels were not included in the analyses.