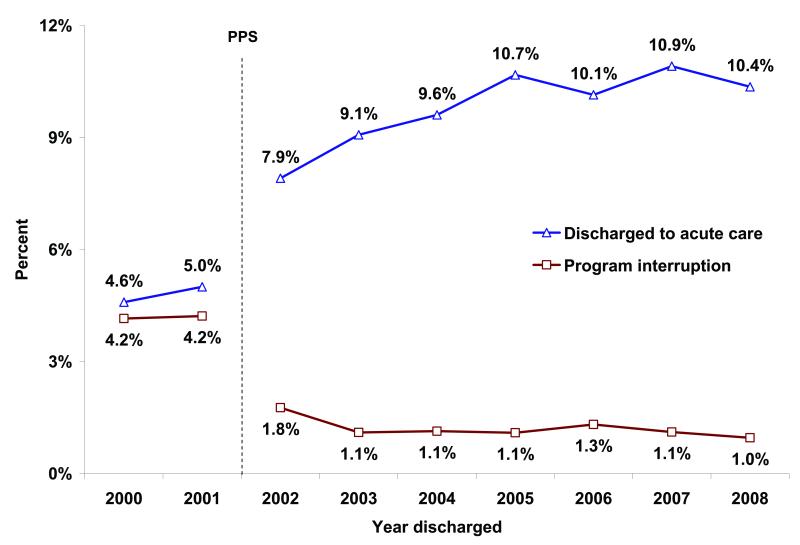
Figure 1.
Percentage of program interruptions* and cases discharged to acute care by discharge year.
Yearly summaries represent fiscal year periods (Oct 1 through Sep 30) from the Centers for Medicare and Medicaid Services. Dashed vertical line signifies introduction of the prospective payment system (PPS), resulting in substantial changes to functional evaluation and patient management processes. * In 2002 the definition for program interruption changed from ≤ 30 days to ≤ 3 days.

