Fig. 8.
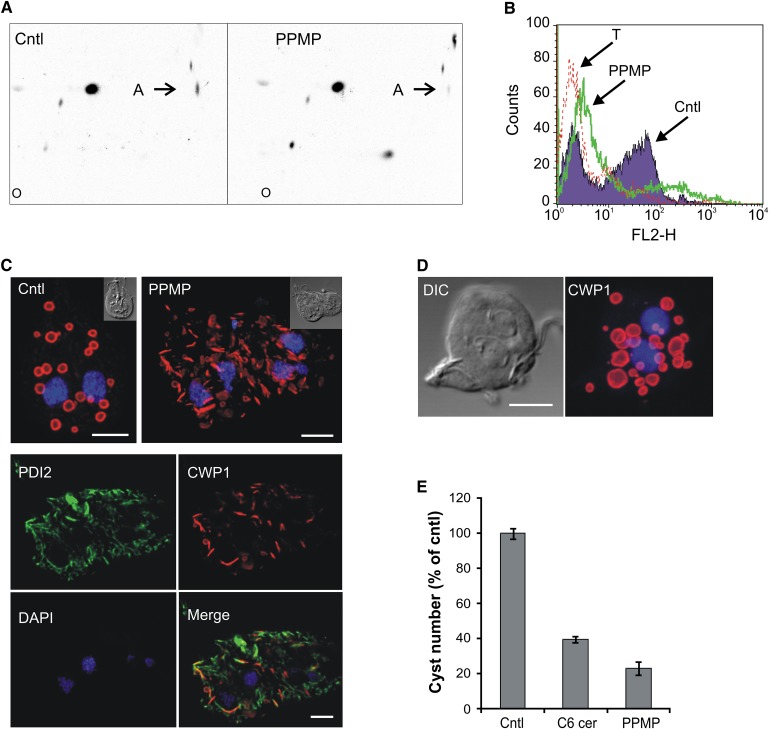
Inhibition of GlcCer synthesis perturbs CWP1 trafficking. A: Parasites were isolated 24 h after induction of encystation and labeled with [3H]palmitic acid for 3 in presence of 10 μM PPMP or solvent (cntl). Lipid aliquots corresponding to equal protein amount were separated by 2D-HPTLC using the solvent system A. Note the decreased GlcCer levels (spot A) in presence of the inhibitor. B: FACS analysis of parasites encysted for 16 h in presence of solvent (cntl) or 10 μM PPMP and stained for CWP1. Note the modest CWP1 expression in PPMP-treated samples. T, CWP1-stained trophozoites, used as negative control of CWP1 expression. C: Fluorescence analysis of parasites encysted for 16 h in presence of 10 μM PPMP or solvent (cntl) and stained for CWP1 (red), ER-marker PDI1 (green) and nuclei (blue). Upper images, maximum projections; lower images, single optical sections of the deconvolved image stacks. Insets: differential interference contrast (DIC) images. Note the colocalization of CWP1 and PDI2 in PPMP-treated samples. D: Fluorescence analysis of parasites encysted for 16 h in presence of 6 μM nocodazole and stained for CWP1 (red) and nuclei (blue). DIC, differential interference contrast image. Scale bars: 3 μm. E: Parasites were encysted for 16 h in presence of 10 μM PPMP, 20 μM C6 ceramide or solvent (cntl) and stained for CWP1. Cyst number (out of the total cell number) is presented as percentage of control ± SE (n = 3) of a representative from two experiments done in triplicate.

