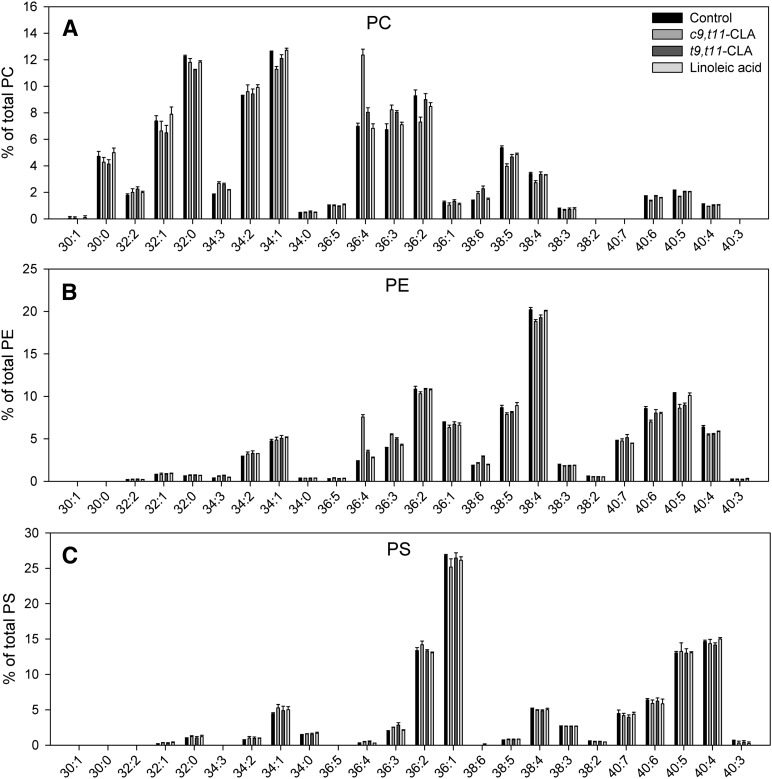
Fig. 1.
c9,t11-CLA, but not t9,t11-CLA induces a shift to PC 36:4 and PE 36:4. A: PC species profile for untreated cells and cells treated with 10 µM CLA or linoleic acid for 4 h and quantified by ESI-MS/MS (PC 36:4 upon c9,t11-CLA treatment: P < 0.001). B: PE species profile for untreated cells and cells treated with 10 µM CLA or linoleic acid for 4 h and quantified by ESI-MS/MS (PE 36:4 upon c9,t11-CLA treatment: P < 0.001). C: PS species profile for untreated cells and cells treated with 10 µM CLA or linoleic acid for 4 h and quantified by ESI-MS/MS. Values are mean ± SD of one representative experiment from three, each performed in triplicate. CLA, conjugated linoleic acid; PC, phosphatidylcholine; PE, phosphatidylethanolamine.

