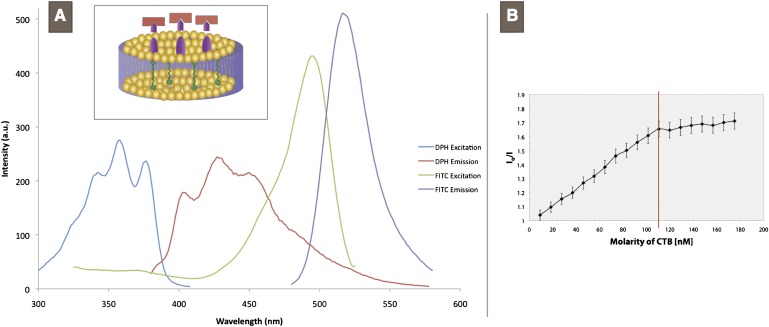
Fig. 2.
Characterization of FRET pair and toxin-quencher titration. A: Excitation and emission spectra of DPH and FITC-CTB. Intensity of each spectrum is not to scale. Inset: schematic representation of DPH (green) embedded in the hydrophobic core of the lipoprotein (yellow) and its proximity to a receptor (purple) and fluorescently-labeled pentavalent ligand (red). B: Stern-Volmer plot of GM1-CTB binding for DMPC vesicles containing 1.0 mol% GM1. The independent axis is molarity of CTB (nM) and the dependent axis is the inverse normalized donor fluorescence (Io/I). Error bars are derived from instrument error. The entire collection of S-V plots are available in the supplementary data. CTB, cholera toxin subunit B; DMPC, 1,2-dimyristoyl-sn-glycero-3-phosphocholine; DPH, diphenylhexatriene; FITC, fluorescein-isothiocyanate; FRET, Foerster Resonant Energy Transfer; GM1, monosialotetrahexosylganglioside.

