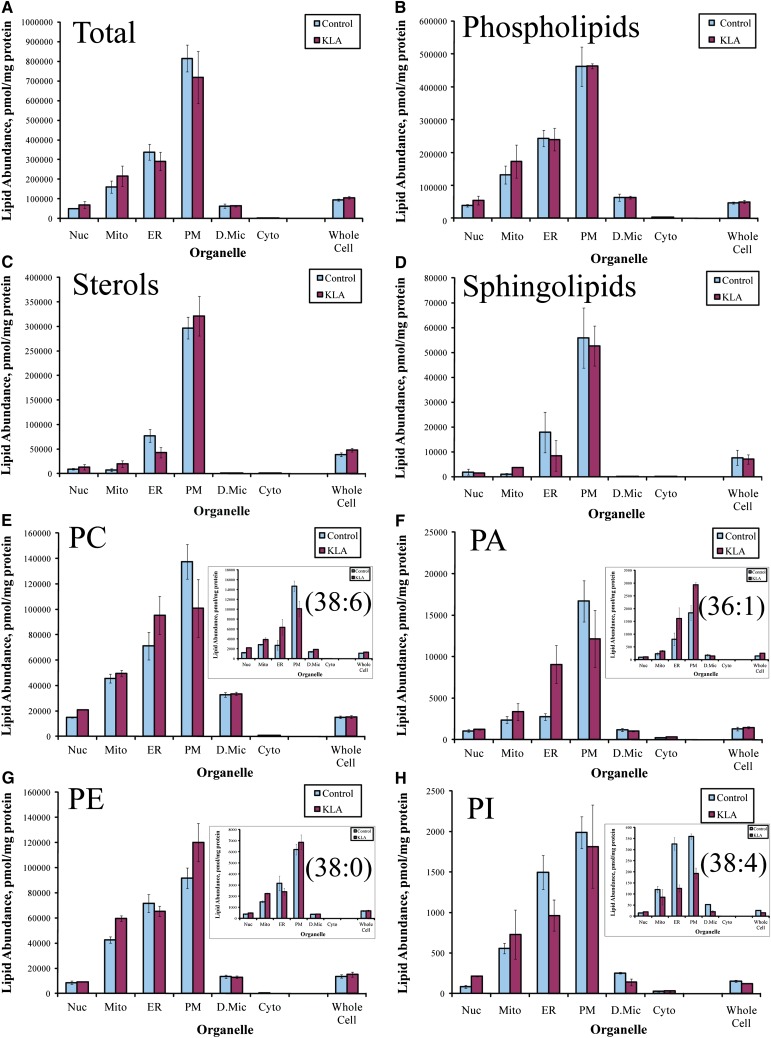
Fig. 1.
Organelle lipid distribution profile (organellar factor). A: Total lipid. B–D: Total glycerophospholipids, sterol lipids, and sphingolipids, respectively. E–H: Total PC, PE, phosphatidic acid (PA), and phosphatidylinositol (PI), respectively (inserts: representative species). Data shown are sums of data for molecular species, mean ± SE, n = 3.

