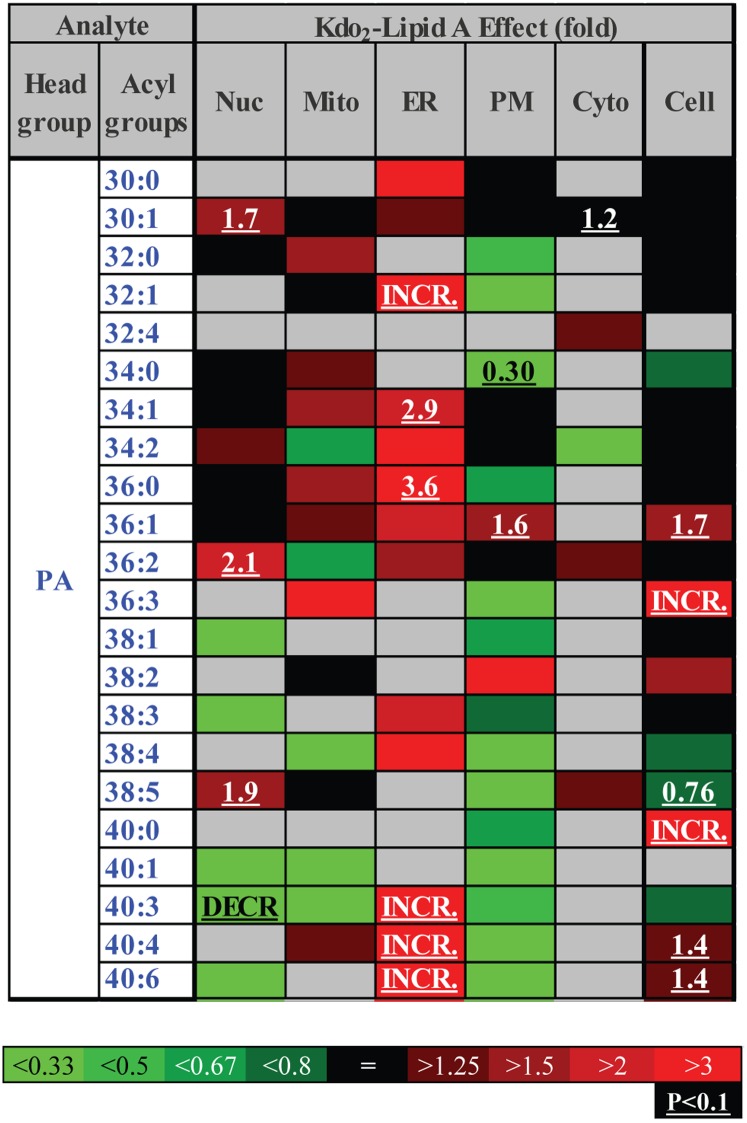
Fig. 6.
ER-specific increase in phosphatidic acid (heat map). Each box represents an isobaric group. Changes are color-coded; numbers indicate statistically significant fold-changes. INCR., increase from zero; DECR., decrease to zero; Nuc, nuclei; Mito, mitochondria; PM, plasmalemma; D.Mic, dense microsomes; Cyto, cytoplasm. Acyl groups are abbreviated by the numbers of carbon atoms and double bonds per molecule.

