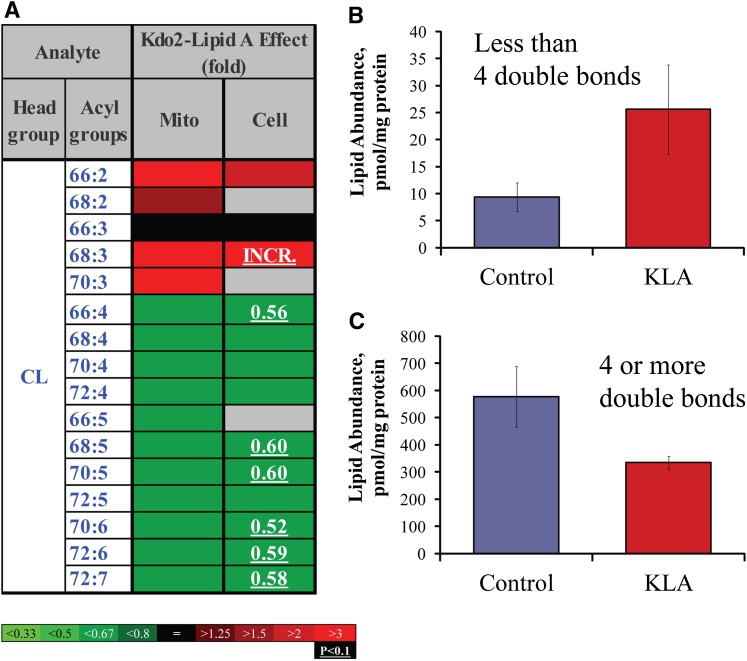
Fig. 7.
Shift of CL profile to less unsaturated species. A: Heat map. Each box represents an isobaric group. Changes are color-coded; numbers indicate statistically significant fold-changes. INCR., increase from zero. Acyl groups are abbreviated by the numbers of carbon atoms and double bonds per molecule. Mito, mitochondria. B: Highly unsaturated CLs (four or more double bonds). C: Moderately unsaturated CLs (two or three double bonds). Data (B and C) are mean ± SE, n = 3.

